

Confidence Rating Scale: How to Design and Use It

A high confidence number can look like a clear instruction: trust this image, reject that one, or escalate the case. But a confidence score isn't a decision, and it isn't automatically a probability that the result is correct. Its meaning depends on how the system was tested, what kind of image it's analyzing, and what happens if it gets the call wrong.
That distinction matters in practical settings. A journalist deciding whether to publish a photograph faces a different risk from a marketplace moderator deciding which listing to review. A useful confidence rating scale makes those differences visible instead of letting a precise-looking number make the decision by itself.
Why a Confidence Number Is Not a Decision
I see a 92% confidence score. What should I do with it?” The number alone can't answer. It might describe an estimated probability, a model's internal certainty, or a score that ranks one image as more suspicious than another. Without knowing which, you can't tell whether 92% means “usually correct in cases like this” or merely “the model strongly favors this label.
A weather forecast offers a familiar comparison. A 70% chance of rain might change your plan for an outdoor picnic, while a wedding organizer might arrange an indoor backup. The forecast hasn't changed. The consequences of acting on it have. Image verification works the same way: a doubtful result may justify a closer look, but it shouldn't automatically justify an accusation or a consequential decision.
Practical rule: Treat a score as evidence to interpret, not an instruction to obey.
The central question is whether the score is reliable for the image and task in front of you. A detector may appear confident while handling an unfamiliar generator, a compressed social-media image, or a file that combines human and AI editing. Even a strong result on familiar examples doesn't establish that the score means the same thing in every setting.
This is why a useful confidence rating scale must connect score meaning, validation conditions, and next steps. If you're comparing candidates for a role, for instance, a tool that helps score Australian Government ICT candidates illustrates a broader point: a score only helps when users understand what it measures and how it should inform review. For image checks, learning the difference between a probability and certainty can prevent a confident-sounding label from becoming a premature conclusion.
What a Confidence Rating Actually Represents
A confidence rating is a system's signal about a prediction. It may be useful, but its label alone doesn't tell you what the number represents. To interpret it, separate three ideas that often get blended together.
Three meanings that can hide behind one number
Estimated likelihood is the probability that a prediction is correct or that an image belongs to a class, such as AI-generated. That interpretation is justified only if the score has been calibrated and tested on relevant examples.
Model certainty describes how strongly a model favors its chosen answer. A system may assign one label a much higher score than the alternatives, but that strong preference doesn't prove the label is right. A student who feels sure about a test answer can still be mistaken.
Ranking strength tells you that one case seems more suspicious than another. A spam filter might rank one message above another for review without claiming that either message has a precisely known probability of being spam. That can be useful for sorting a queue, but it's different from making a calibrated prediction.
Think of a doctor assessing a patient. The diagnosis, the doctor's confidence in it, and the likelihood that the diagnosis is correct are related, but they aren't interchangeable. A careful clinician also considers symptoms, available tests, and uncertainty. An image detector needs similar context: what it predicts, how it arrived at the result, and whether the image resembles the cases used for evaluation.
Calibration is the test of whether probability-like scores match actual outcomes over comparable cases. If a model assigns many images the same probability, calibration asks whether roughly that share of those images belongs to the predicted class. This is the next question to ask after identifying what a score claims to mean.
A useful analogy from financial screening is a meme coin scam pattern checker. A risk score can help someone prioritize investigation, but the number shouldn't be mistaken for proof that a particular case is fraudulent. In the same way, a detector's confidence rating can guide a verification process without settling the question on its own.
Common Scale Formats and When to Use Each
The format you choose shapes what readers think the result means. A small scale is easy to scan, a percentage looks precise, and an agreement scale captures a person's judgment. None is best for every job.
| Format | Strengths | Weaknesses | Best Fit For |
|---|---|---|---|
| 1–5 numeric scale | Familiar and quick to read | The meaning of each step can be vague | Simple ratings or triage labels |
| Percent or 0–1 scale | Suggests a probability and supports precise comparisons | Implies calibration that may not exist | Validated probabilistic predictions |
| Likert-style agree/disagree scale | Captures a person's opinion or self-reported confidence | Doesn't directly express a model's probability | Surveys, feedback, and human judgments |
A 1–5 scale can work well when the labels explain the levels: for example, “low confidence,” “review recommended,” and “high confidence.” Without clear definitions, two users may interpret the same rating differently. A rating of 4 might feel decisive to one person and merely suggestive to another.
A percentage scale gives more detail, but it also raises the stakes. If a detector displays a specific probability, users can reasonably expect that similar scores correspond to similar real-world outcomes. Unless evaluation supports that interpretation, the decimal places or percentage signs may create more precision than the system has earned.
A Likert-style scale is a series of ordered responses, such as “strongly disagree” through “strongly agree.” It's useful when asking a person how confident they feel. It's a poor substitute for a model probability because a person's self-reported confidence doesn't reveal whether their judgments are accurate.
Choose the scale that supports the action you need, not the one that looks most technical.
For a practical example of a confidence scale for investment offers, consider what a reader needs to decide before choosing labels. If the score supports human review, plain-language categories may be more useful than a percentage. If it claims to estimate likelihood, the provider should show how that estimate was evaluated.
How Calibration Turns a Number Into a Meaning
Calibration checks whether a model's probability-like scores line up with what happens. A detector is well-calibrated if, among images assigned a confidence of 0.80, approximately 80% belong to the predicted class under a comparable operating distribution. That definition comes from the verified calibration guidance on AI-image detectors, not from the visual appearance of a score.
Here's a simple example. Suppose a detector assigns a group of images the same probability. If the predicted class is correct for about the share stated by that probability, the score is behaving as a calibrated estimate for that group. If far fewer predictions are correct, the model is overconfident. If more are correct, it may be underconfident.
How teams check calibration
A reliability diagram groups predictions by confidence and compares each group's average score with its observed accuracy. A well-calibrated system tracks close to the line where predicted confidence matches observed results. A diagram that shows high-confidence predictions repeatedly doing worse than their scores suggest is a warning sign.
The expected calibration error, or ECE, summarizes the gap between predicted confidence and observed accuracy across confidence groups. The Brier score offers another way to assess the quality of probability predictions. Neither measure replaces examining performance for the image types and conditions that matter in the intended workflow.
Calibration also answers a question that overall accuracy can't: does the number mean what users think it means? A model can classify many images correctly while still assigning unjustifiably high confidence to particular cases. That matters when a score guides publication, moderation, or a legal or academic decision.
Ask for evidence: A confidence rating should come with information about how its reliability was evaluated, not just a label or a precise-looking number.
When reviewing evaluation, look for performance across confidence bands and classes, rather than relying only on a headline accuracy result. Teams can also consult this overview of performance metrics for AI image detection to distinguish measures that describe different aspects of a detector. The key is to ask whether evidence supports the score's stated meaning under conditions similar to the ones you face.
Designing Action Bands Around Your Scale
A number becomes operationally useful when it connects to a defined next step. Action bands group scores into ranges, then assign each range a response: proceed, review, or gather more evidence. The bands should reflect both what the score means and the consequences of acting on it.
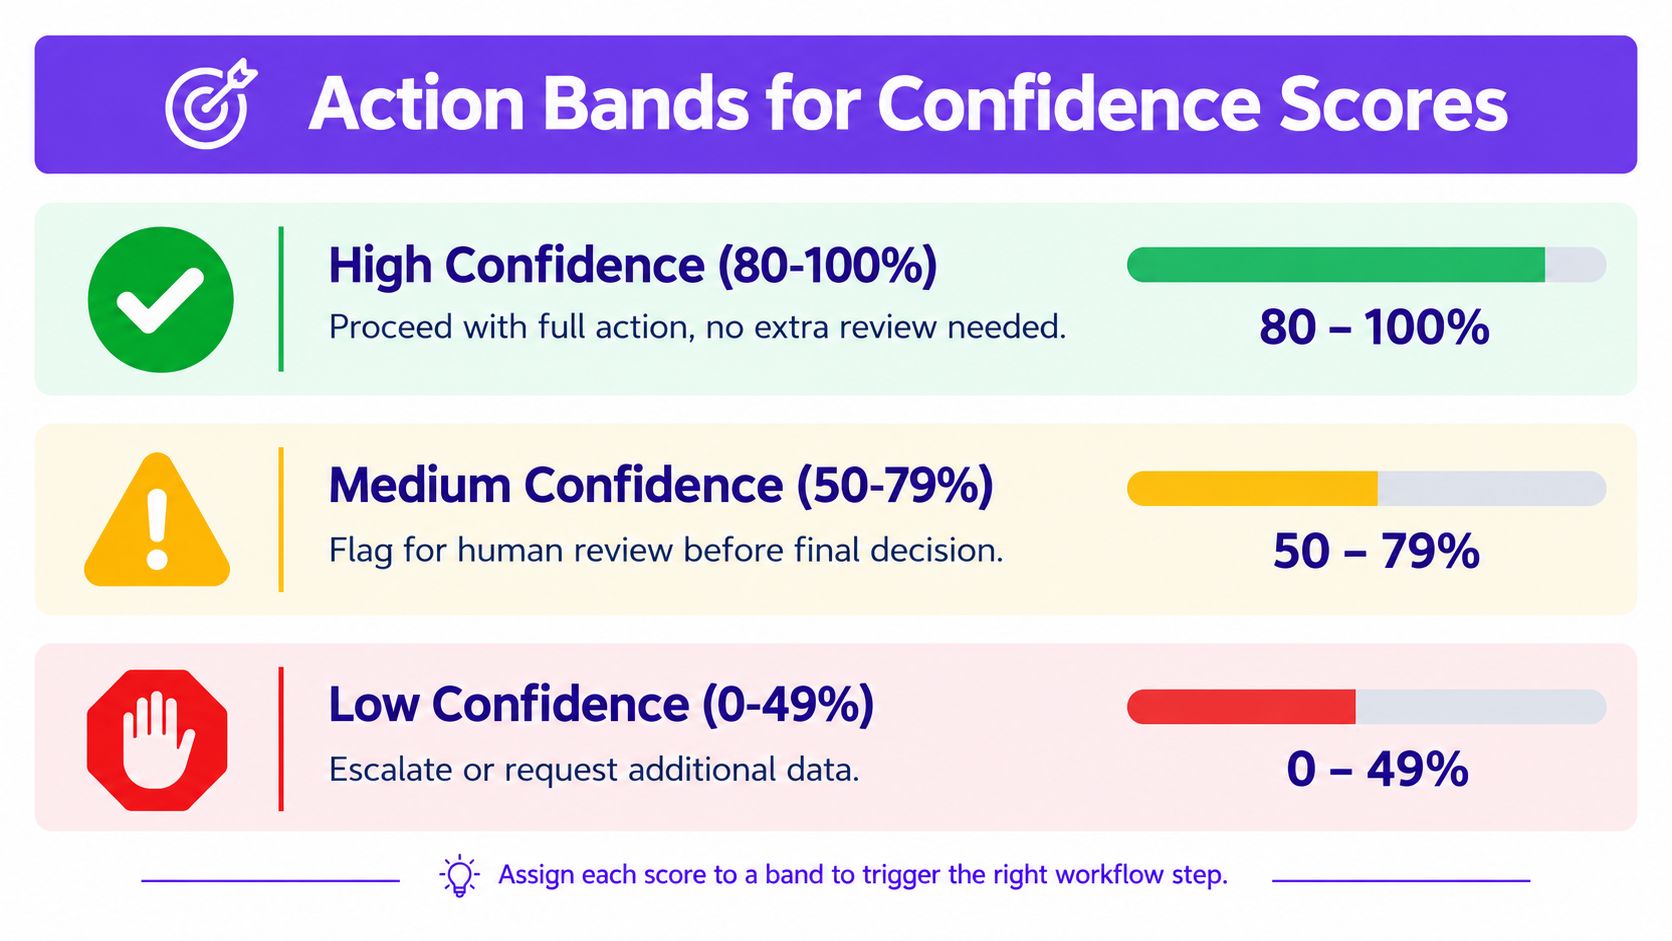
The percentages shown in a chart or interface shouldn't be treated as universal thresholds. A range that works for one tool, task, or validation set may be unsuitable for another. Choose cutoffs only after testing on representative examples and deciding what each possible mistake would cost.
Set thresholds by decision risk
A false positive occurs when a human-made image is incorrectly flagged as AI-generated. A false negative occurs when an AI-generated image isn't flagged. Those errors can have different consequences: wrongly accusing an artist may warrant a more cautious threshold than prioritizing a suspicious marketplace listing for human review.
Use this checklist to define your workflow:
- Name the decision. Specify whether the score triggers review, publication, removal, or another action.
- Compare error costs. Decide how serious false positives and false negatives are in that setting.
- Validate relevant examples. Test the proposed bands on images that resemble actual inputs, including their editing and compression conditions.
- Set a review route. Give intermediate or uncertain cases a clear human-review path.
- Monitor reliability. Recheck the score bands when generator prevalence, image handling, or user populations change.
A score near 0.50 may indicate low confidence, while an intermediate score can require review; high confidence should be assigned only after the threshold has been validated on representative data. These are practical examples of how a scale can be structured, not universal cutoff values. The workflow should make uncertainty visible instead of forcing every image into an automatic yes-or-no decision.
For teams choosing cutoffs, a guide to ROC curve interpretation can help explain how changing a threshold affects detection and false alarms. Keep the final policy grounded in the purpose of the tool: the right threshold is the one that supports a defensible action, not the one that maximizes automation at any cost.
Confidence Ratings in Real Detection Workflows
A journalist receives a dramatic image from an unfamiliar account before publication. The detector returns a likely-AI result, but the newsroom shouldn't treat that label as proof. The journalist can check the original file, verify the source, search for earlier appearances of the image, and ask whether the detector's confidence applies to its generator and editing history.
A marketplace moderator faces a different workflow. A queue may contain suspicious listings that need prioritization, but a detector's ranking should help direct review rather than automatically establish that a seller acted improperly. Moderators can combine the signal with listing context and platform rules, then reserve stronger action for cases supported by additional evidence.
An educator checking a student submission should be especially cautious about treating a score as a verdict. A flagged image could reflect an unfamiliar generator, partial AI editing, or a transformed file. The teacher can discuss the student's process, examine available drafts or source material, and follow the institution's academic-integrity process before drawing conclusions.
These examples share one rule: the result begins verification; it doesn't finish it. A scale is more helpful when it shows the verdict alongside an explanation and a clear indication of whether the image falls within the system's validation coverage. A bare percentage can't communicate all of that by itself.
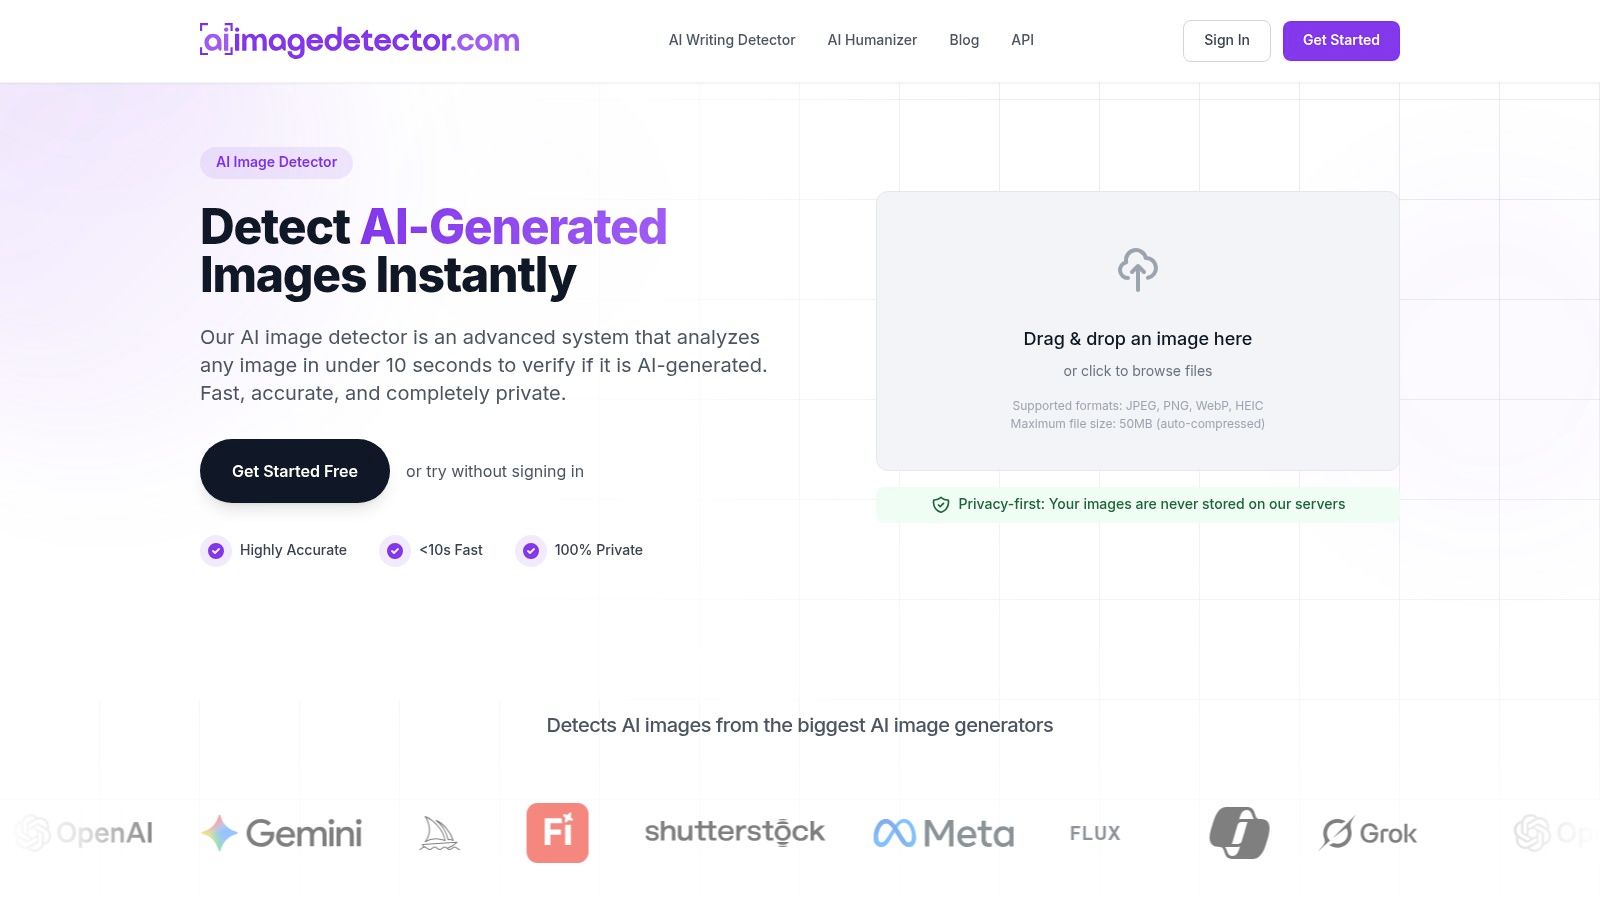
AI Image Detector presents an image-authenticity result on a spectrum from likely human to likely AI-generated, with an unclear or mixed category and explanatory reasoning. That kind of presentation can help users interpret a result, but users still need to consider the file's provenance and the consequences of being wrong.
A video can offer another way to think about image detection before someone applies it in a real workflow.
Out-of-Distribution Uncertainty and Provenance
A model may be calibrated on familiar examples and still perform poorly on an image unlike those examples. Out-of-distribution uncertainty means the system is being asked to assess something that differs from the data it was evaluated on, such as an unfamiliar image generator, a heavily compressed file, or an image with only partial AI editing.
Benchmark evidence makes this risk concrete. One evaluation reported mean detector accuracy ranging from 37.5% to 75.0%, with rankings across dataset pairs showing Spearman correlations from 0.01 to 0.87. It also reported 20–60 percentage-point performance variation within otherwise similar detector families when their training data aligned differently with evaluation data. These results are from a cross-dataset evaluation of AI-image detectors, and they show why one score shouldn't be assumed to transfer to every generator or image condition.
Pair the verdict with applicability
A responsible confidence rating should include an applicability indicator: whether the system has been validated on images with similar generator familiarity, resolution, compression, crop history, and human or AI editing. If it can't establish that the case is well covered, it should communicate the limitation.
For example, a result might say “Likely AI-generated, high model confidence, limited validation coverage.” That wording separates what the model predicts from how confidently users should apply that prediction to the image in front of them.
Provenance matters because an image's history can change how the rating should be read. A social-media copy may have been resized and recompressed; a human photograph may contain an AI-edited background; or a crop may remove visual details relevant to the detector. In a news, identity, or legal context, users should corroborate a result with source verification, metadata, reverse-image search, or inspection of the original file where possible.
Best Practices and Common Questions
A confidence rating scale earns trust by explaining its limits. Don't display a number without context. Pair it with an applicability signal, calibrate before deployment, monitor performance as inputs change, and treat every consequential result as the start of verification.
Does a high score mean an image is definitely AI-generated? No. It's a model output, and its reliability depends on calibration and whether the image resembles the cases used to validate it.
When should I escalate a result? Escalate when the image's provenance is unclear, the file has been altered or compressed, or a false accusation could cause serious harm.
Can I compare scores from different tools? Not safely just because both use percentages. Check what each score represents and whether each system has been evaluated on comparable image conditions.
What if the rating conflicts with my judgment? Don't settle the disagreement by intuition alone. Preserve the image, check its source and editing history, and seek independent evidence before making a high-impact decision.
AI Image Detector provides an image-authenticity result with an explanatory verdict to help users assess whether an image may be AI-generated. If you're building a workflow around confidence scores, use it as one input alongside provenance checks and human review. Visit AI Image Detector to try an image check.