

Confidence Score Machine Learning Explained Simply

A confidence score can look like a simple answer, but in machine learning it's usually a harder question in disguise. A journalist, educator, or moderator sees 90% on screen and is tempted to read it as “90% chance this is true.” That shortcut is exactly how good tools get overtrusted and bad decisions get published.
The safer way to read a confidence score machine learning output is this, the number is evidence strength under specific conditions, not a verdict pulled from reality. A calibrated score can be useful, but only if you know what data it was tested on, what happens when the image changes, and what action the score justifies. If you want a plain-language companion on uncertainty bands and how to think about them, confidence interval methods explained gives a useful starting point.
Why a 90% Confidence Score Is Not What You Think
A 90% confidence score does not automatically mean the model is right nine times out of ten on the image sitting in front of you. It means the system produced a number that looks like a probability, but that number is only trustworthy if it was calibrated on data that resembles your case. In practice, that distinction matters because a detector can sound precise while still being wrong on edited, compressed, or unfamiliar images.
Think about a journalist checking a suspicious image before publishing a story. The tool flags “90% AI-generated,” and the number feels decisive, almost like a receipt. But the model didn't inspect reality, it transformed pixels through layers it learned during training, then emitted a score based on patterns it recognizes.
The mental trap behind the number
The trap is treating one output as if it contains the whole truth. A high score can reflect learned patterns, class imbalance, or the way the model was post-processed, not a direct measurement of whether the image was created by a person or a generator. That's why analysts often separate the score from the decision.
A better habit is to ask three questions every time:
- What was this score calibrated on?
- What happens when the image is outside the training distribution?
- What action does this score license?
Practical rule: if the score is being used for a public accusation, treat it as a lead, not proof.
For teams that want a structured way to think about uncertainty, the same logic used in probability reporting for model outputs is the logic behind a calibrated estimate. The number becomes meaningful only when repeated predictions at that level behave the way the score suggests.
How Machine Learning Confidence Scores Are Actually Produced
Most confidence outputs come from the same basic pipeline. The model computes internal values, often called logits, for each class, then converts those values into normalized scores, usually through softmax in classification systems. The top class is the label with the highest output, and the accompanying confidence is derived from the size of that top score relative to the others.
A weather forecast helps here. Saying “70% chance of rain” is different from saying “the system leans toward rain with score 70.” The first is meant to describe frequency under matched conditions. The second can just be a ranking signal that happens to be scaled into a familiar probability-like form.
Probability-looking numbers are not the same as truth
That difference matters because the score is a function of the model's outputs, not a field measurement from the world. A network can choose the top class correctly and still be too sure or not sure enough. That's why researchers use temperature scaling on held-out validation data, to soften or sharpen score distributions so they line up better with reality.
| Common Ways Confidence Scores Are Expressed | What It Means | Typical Range | Where You See It |
|---|---|---|---|
| Top-class probability | The model's strongest class after normalization | 0 to 1 | Image and text classifiers |
| Margin score | Gap between the top class and the runner-up | Model-dependent | Ranking and triage systems |
| Abstention score | Signal used to decide whether to answer at all | Model-dependent | Safety filters and review queues |
If you're looking at a product like guide to AI image enhancement, the same mathematical idea shows up in image-processing pipelines, where outputs can look polished while the underlying confidence story still needs calibration and context.
Ask one blunt question of any score, is this a probability, or a ranking signal dressed up as a probability?
Calibration, Reliability Diagrams, and the ECE Metric Explained
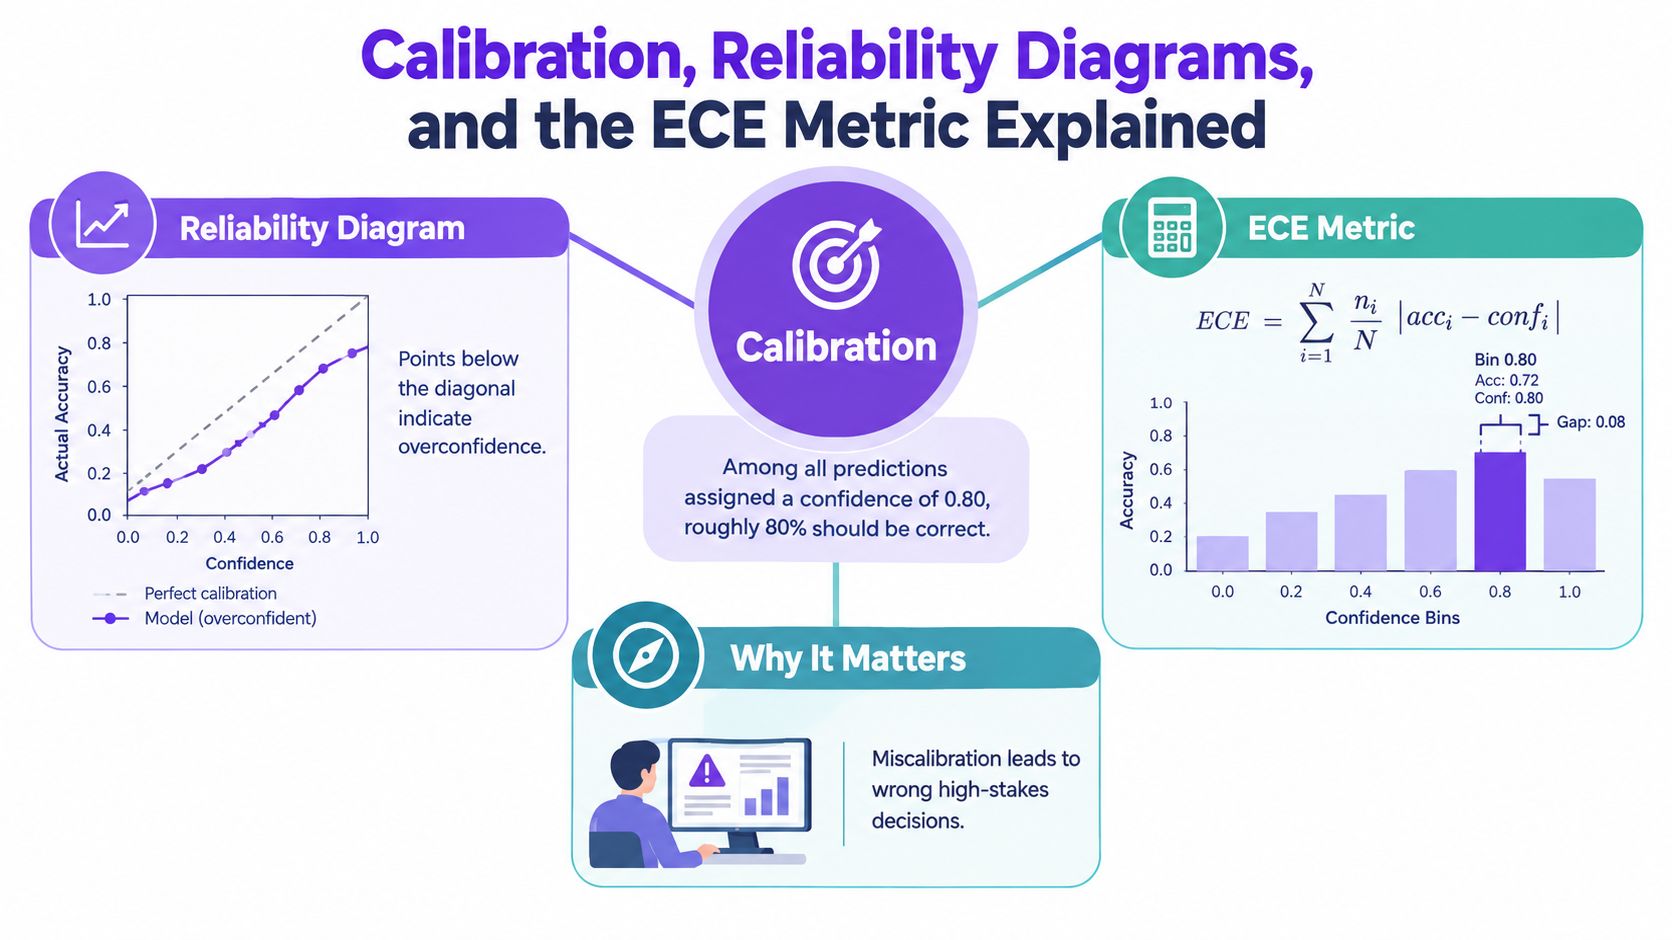
Calibration means the score lines up with reality on average. If a model gives 0.80 confidence to a group of predictions, then about 80% of those predictions should be correct. That turns the score into evidence strength under specific conditions, which is what readers need when they are deciding whether to trust a detector.
A reliability diagram is the quickest way to check that alignment. It sorts predictions into confidence bins, then compares each bin's average confidence with its actual accuracy. Points near the diagonal show close calibration. A curve below the line means the model is overconfident. A curve above it means the model is underconfident.
What ECE tells you at a glance
The Expected Calibration Error, or ECE, compresses those gaps into one summary number. It is a weighted average of the absolute differences between confidence and accuracy across bins, so an ECE near zero means the score and the observed results are close. A larger ECE means the score is drifting away from what the model gets right.
That matters because a single percentage can sound more exact than it is. For image verification, a label like “90% AI-generated” should mean roughly nine correct decisions out of ten on representative held-out data, not just that the model favored one class. Calibration has to be measured on held-out data because training performance can hide memorization, class imbalance, and distribution shift. For a broader overview of how these measures are reported, see this guide to performance metrics.
The practical test is straightforward. Ask the vendor for the ECE on held-out data, and ask to see the reliability diagram. If they cannot produce it, treat the percentage as a ranking signal only.
Ranking, Probability, and the Power of Saying I Don't Know
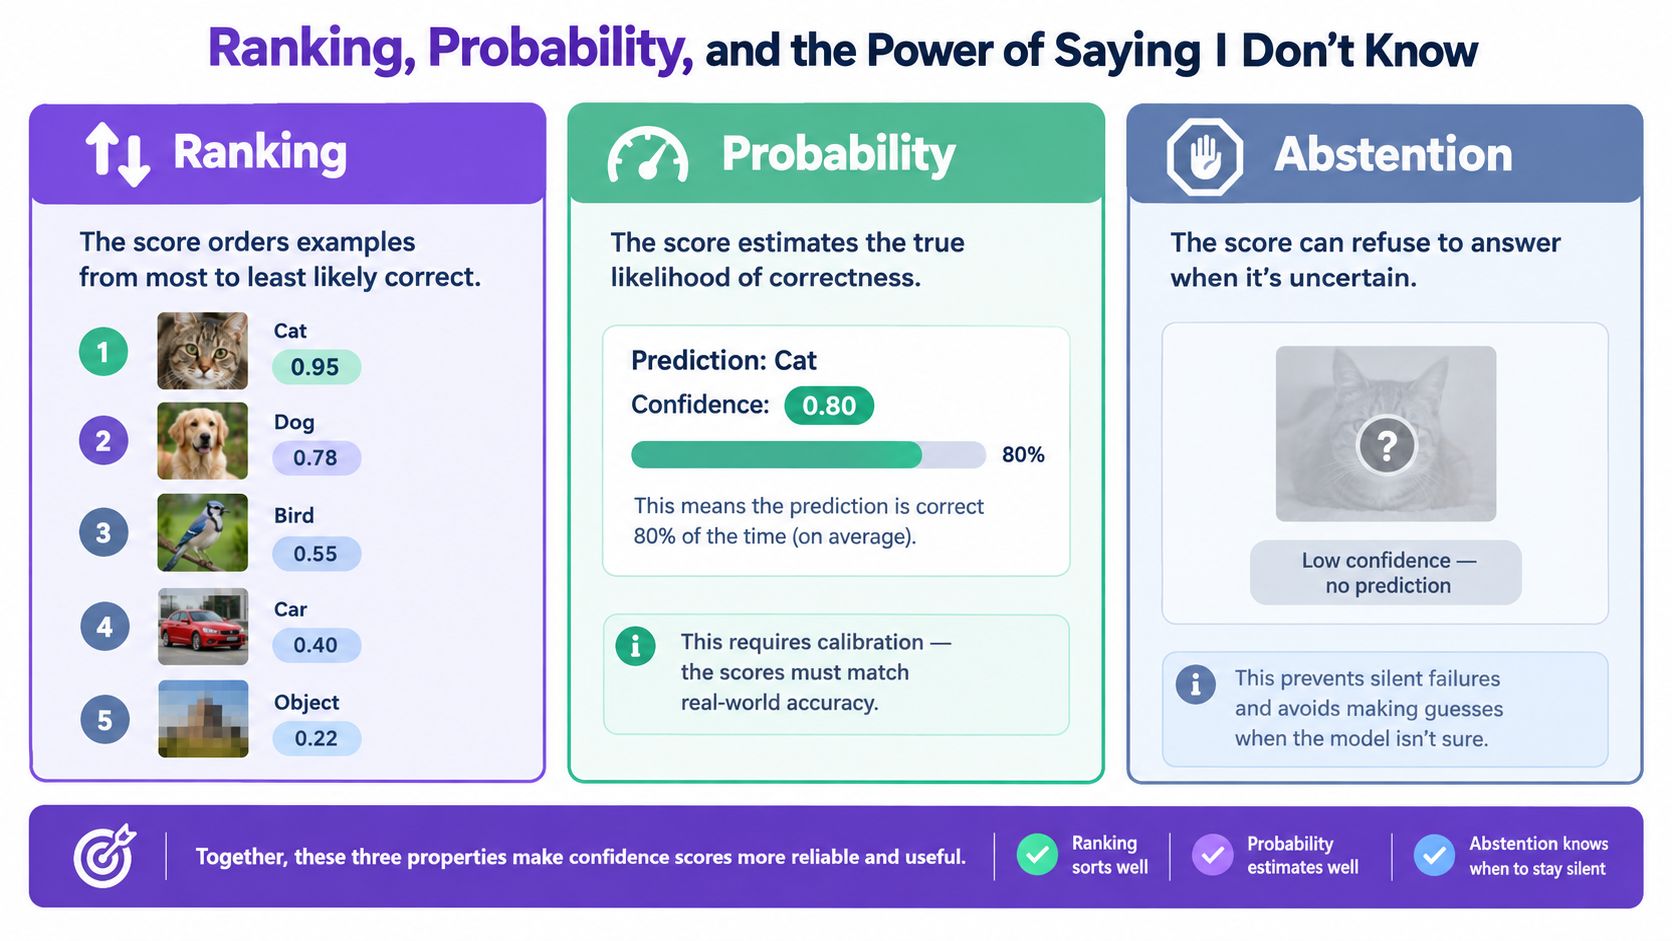
A score can do three different jobs, and they're not the same. It can rank examples from most likely to least likely. It can estimate probability well. Or it can abstain, meaning it refuses to answer when uncertainty is too high.
That last property is underrated. If a detector is uncertain, “I don't know” is often more valuable than a precise-looking wrong answer, especially when the downstream consequence is public accusation, academic discipline, or platform enforcement. Ranking alone can still be useful, but only if the system is good at separating easy cases from hard ones.
Why abstention beats fake certainty
A short ranked list makes the issue obvious. A clear cat photo may get a high score, a blurry dog photo may land in the middle, and a heavily pixelated object may sink to the bottom. That ordering helps, but it doesn't prove the score is a probability. It only shows the model is better at sorting than at telling the truth about its certainty.
Recent evaluation work makes the gap hard to ignore. A 2025 ICLR study, A Sanity Check for AI-generated Image Detection, found that nearly all evaluated off-the-shelf detectors misclassified challenging AI images as real, and a separate 2025 NeurIPS benchmark reported significant performance drops on real-world data from social media and AI-art platforms despite strong controlled-setting accuracy (ICLR tutorial survey). That means a pretty percentage can survive long after the model's real-world reliability has broken down.
The practical lesson is counterintuitive but important. Improving abstention and uncertainty reporting can matter more than making the percentage look sharper. A tool that says “uncertain” in the right moments helps people avoid silent failures.
What Happens to Confidence When the Image Is Outside the Training Distribution
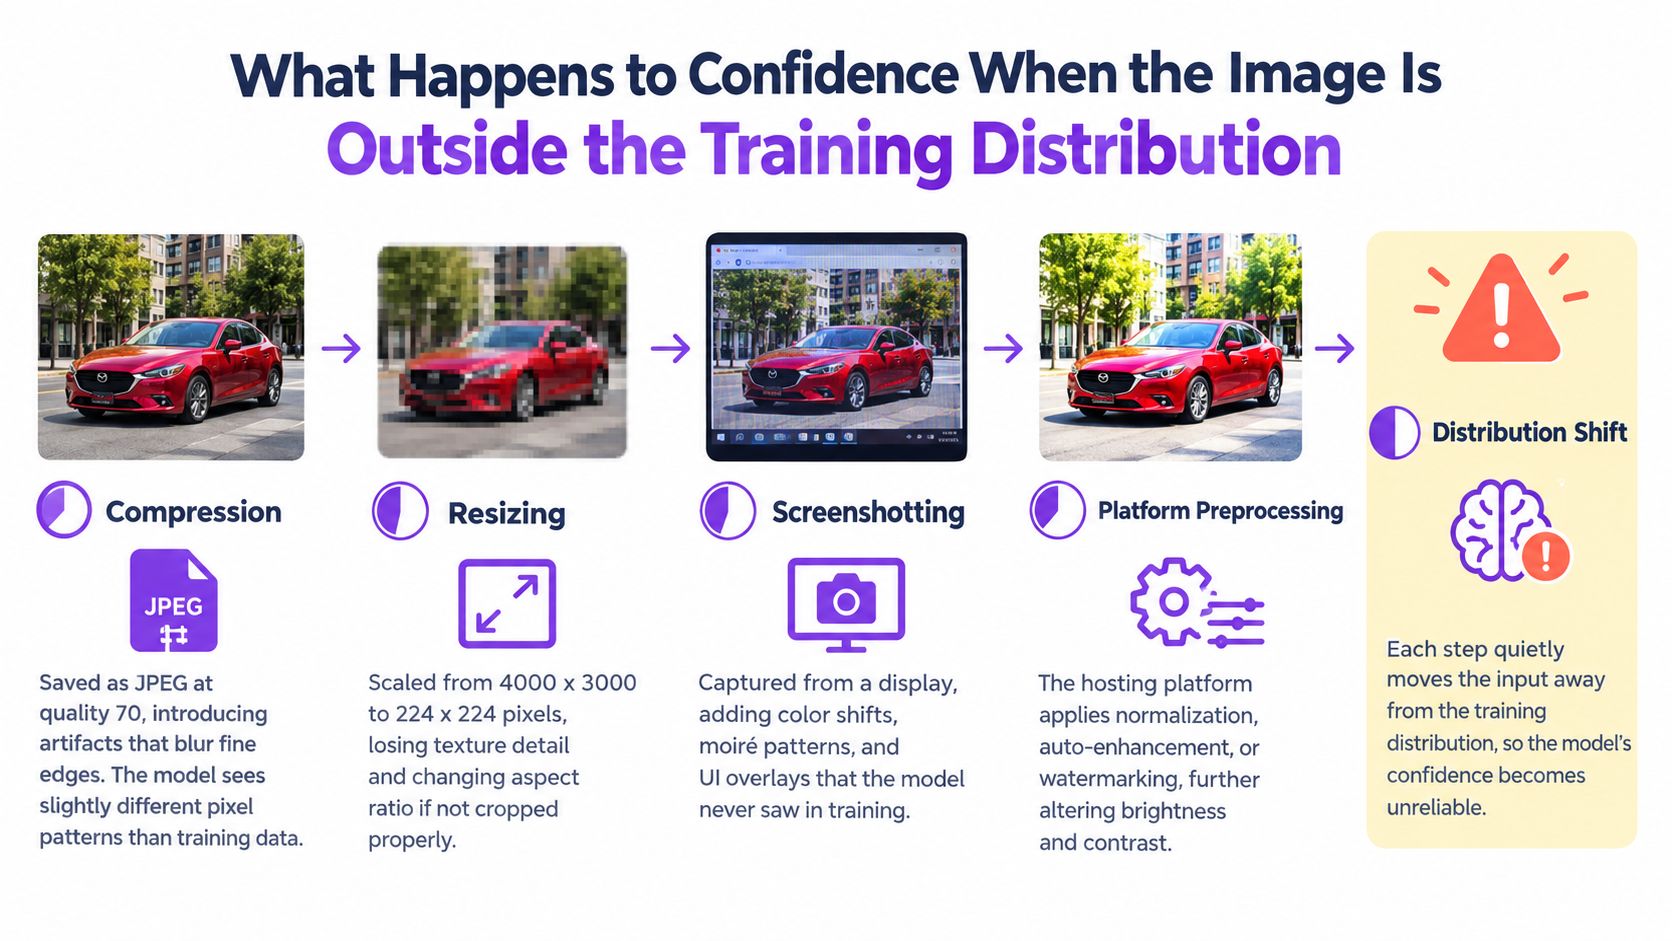
An image can leave the model's comfort zone without changing much to a human eye. Compression adds artifacts, resizing removes detail, screenshotting introduces screen noise, and platform preprocessing can alter brightness or contrast. Each step shifts the pixel patterns away from the training distribution the detector learned from.
That's why a score can stay high while reliability collapses. The model still outputs a number, but the number no longer corresponds cleanly to the world it was trained to describe. Out-of-distribution behavior is one of the main reasons a confident detector can fail on a real social post even when it looked strong in a lab benchmark.
The quiet ways input data changes
A journalist rarely gets the original file. The image may have been saved as JPEG, resized by a CMS, reposted through a social platform, then captured again in a screenshot. By the time it reaches the detector, the input has changed shape several times.
A useful skeptic's checklist looks like this:
- Compression: artifacts can blur edges and texture cues the model depends on.
- Resizing: detail loss can remove signals the detector expects to see.
- Screenshotting: display noise, overlays, and color shifts add unfamiliar patterns.
- Platform preprocessing: normalization or enhancement can alter brightness and contrast.
The point isn't that these transformations always break the model. The point is that they create conditions where the score should be treated as less trustworthy, because the input may no longer match the environment where calibration held up. For a practical test workflow, the process described in how to test AI is useful because it encourages verification against the file you have, not the file you wish you had.
Turning Scores Into Decisions Without Becoming Overconfident
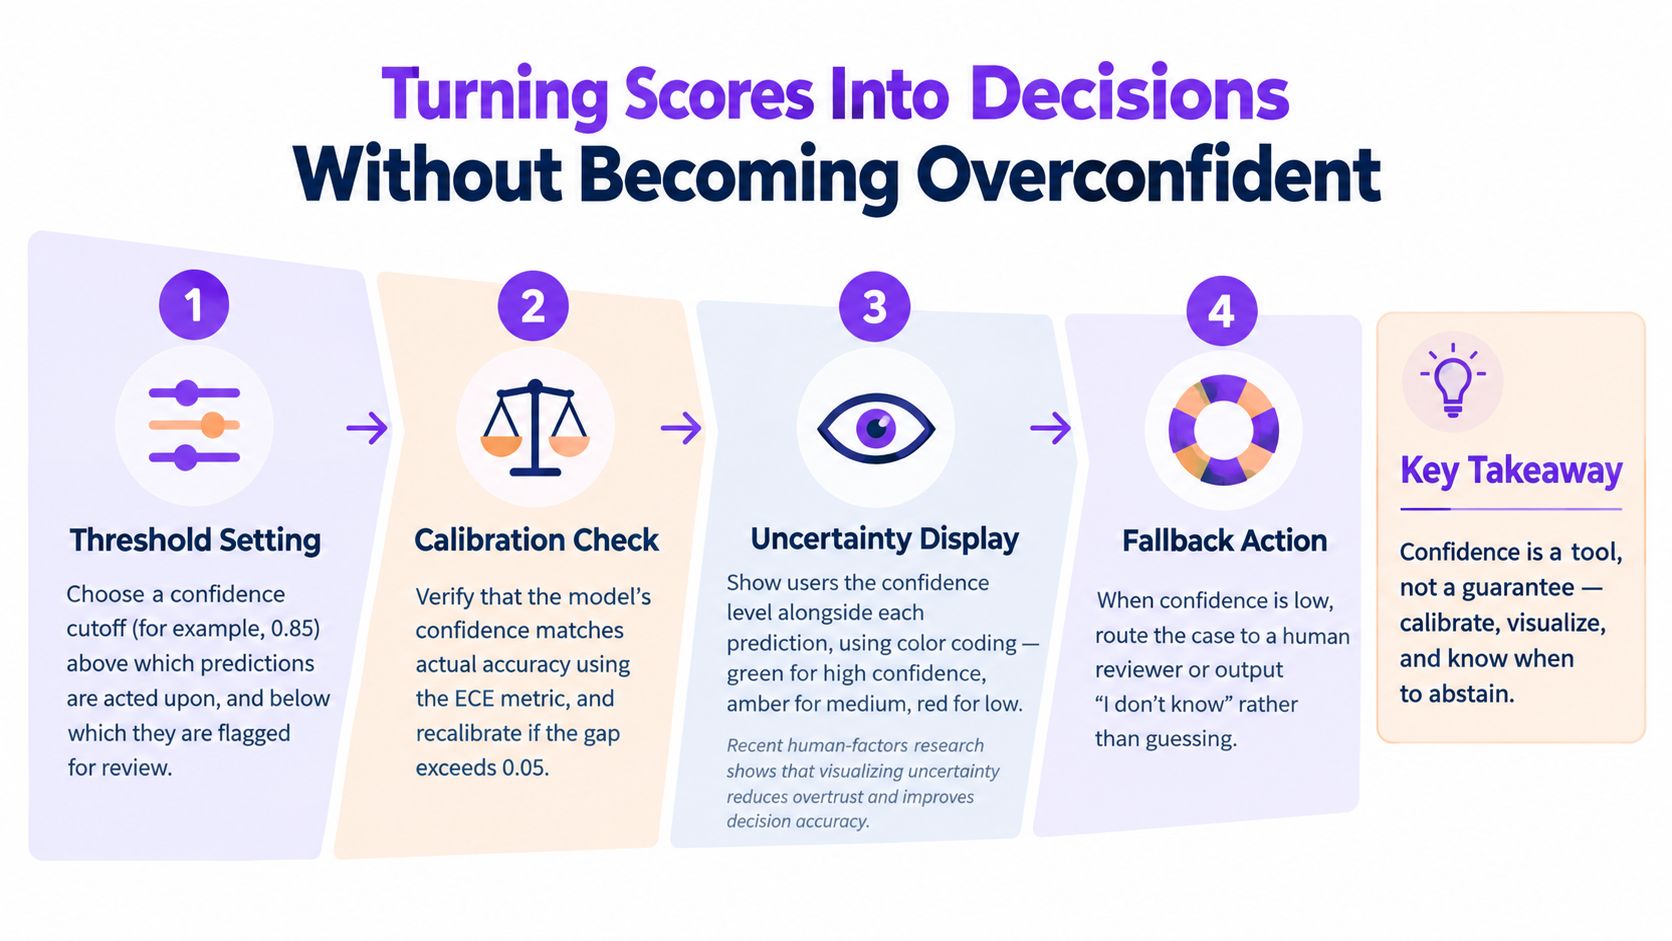
A score becomes useful when people attach it to a rule, not when they stare at it. In a recent human-factors study, visualizing uncertainty increased trust among 58% of participants who initially held negative attitudes toward AI, and 31% found the visualization useful, although the display format changed how much people trusted the system and how confident they felt. Another 2025 experiment found that uncertainty estimates improved accuracy, especially when the person was unsure but the model was highly confident, while explanations improved feature understanding and counterfactual reasoning (Frontiers in Computer Science).
That's promising, but it cuts both ways. Better displays can raise subjective certainty without guaranteeing a correct decision. So the goal isn't to make people trust the model more, it's to make them use it more carefully.
Three operational rules that hold up
Separate model confidence from evidence strength.
A score tells you how strongly the model leans one way. It does not prove the image's origin.Require corroboration for high-impact accusations.
If the outcome affects reputation, access, or discipline, pair the score with provenance, metadata, or independent review.Record the file and its transformations.
Compression history, screenshots, and edits all matter because they can change the score's reliability.
For teams that want to see how confidence fits into live review workflows, truck visual ID model insights show how model outputs are treated as operational signals rather than final judgments. The same principle applies here, the score is a routing tool first, a verdict only after human verification.
Practical Thresholds for Journalists, Educators, and Trust and Safety Teams
Different roles should set different thresholds, even with the same detector. A journalist often needs a stricter review path than a classroom instructor, while a trust and safety team may need a faster triage rule that still leaves room for appeal and escalation. The score does not choose the workflow on its own, the risk attached to the decision does.
A low score does not prove human authorship. It means the detector did not find the AI patterns it was trained to recognize, which is a narrower and more useful statement for a review log.
A simple tiered workflow
- Low confidence: send the item to human review, keep the original file, and record any resizing, reposting, or compression.
- Mid-range confidence: treat the score as a cue to check source history, metadata, or reverse search results before any decision.
- High confidence: verify provenance when possible. For journalists, that can mean holding publication until provenance and reverse search support the score. For educators, a mid-range case should trigger a conversation, not a grade. For moderators, a high-confidence case can go to a human appeal queue within 24 hours. A trust and safety team may need a faster triage rule that still preserves appeal and escalation, and the patterns in this trust and safety content moderation guide show how scores fit into review queues.
For education and moderation, the rule stays simple. Do not publish, penalize, or escalate based only on a model score. Use the score to sort cases, not to close them.
Workflow rule: every meaningful decision should leave an audit trail showing the original image, the file transformations, the score, and the human action taken.
That record protects teams from false certainty and from later disputes. It also makes the review process easier to defend when someone asks why a case was flagged or cleared.
Treat Confidence as Decision Support, Not Proof
A machine learning confidence score is decision support under defined evaluation conditions, not a verdict. The three habits that prevent most mistakes are simple, ask what data the score was calibrated on, ask what happens at the edge of the model's training distribution, and ask what action a given score range allows. If you can't answer those questions, the score isn't ready to stand alone.
That matters even more as synthetic content gets easier to create and harder to distinguish. Calibration, abstention, and provenance will matter more than raw accuracy in 2026 and beyond, because the hardest cases won't be the obvious ones. They'll be the edited, compressed, reposted, and context-stripped images that look ordinary until a human checks the file history.
If you need a detector that returns a clear confidence score alongside an explanatory verdict, AI Image Detector is built for that workflow. It helps journalists, educators, moderators, and risk teams review images quickly, then decide when a score is enough and when a human has to step in.