

Detection Rate in AI Tools: What It Really Means

What if two tools both claim a high detection rate, yet one would work well in your newsroom, classroom, or marketplace and the other wouldn't? That question exposes the gap in how readers interpret this metric. A single percentage looks like a fixed property of a tool, as if it will catch the same share of AI images wherever you use it. It doesn't work that way. The number changes with the generator, the images, the edits, and the way the test was built. Learning to read it means learning what you're counting.
What Detection Rate Actually Means
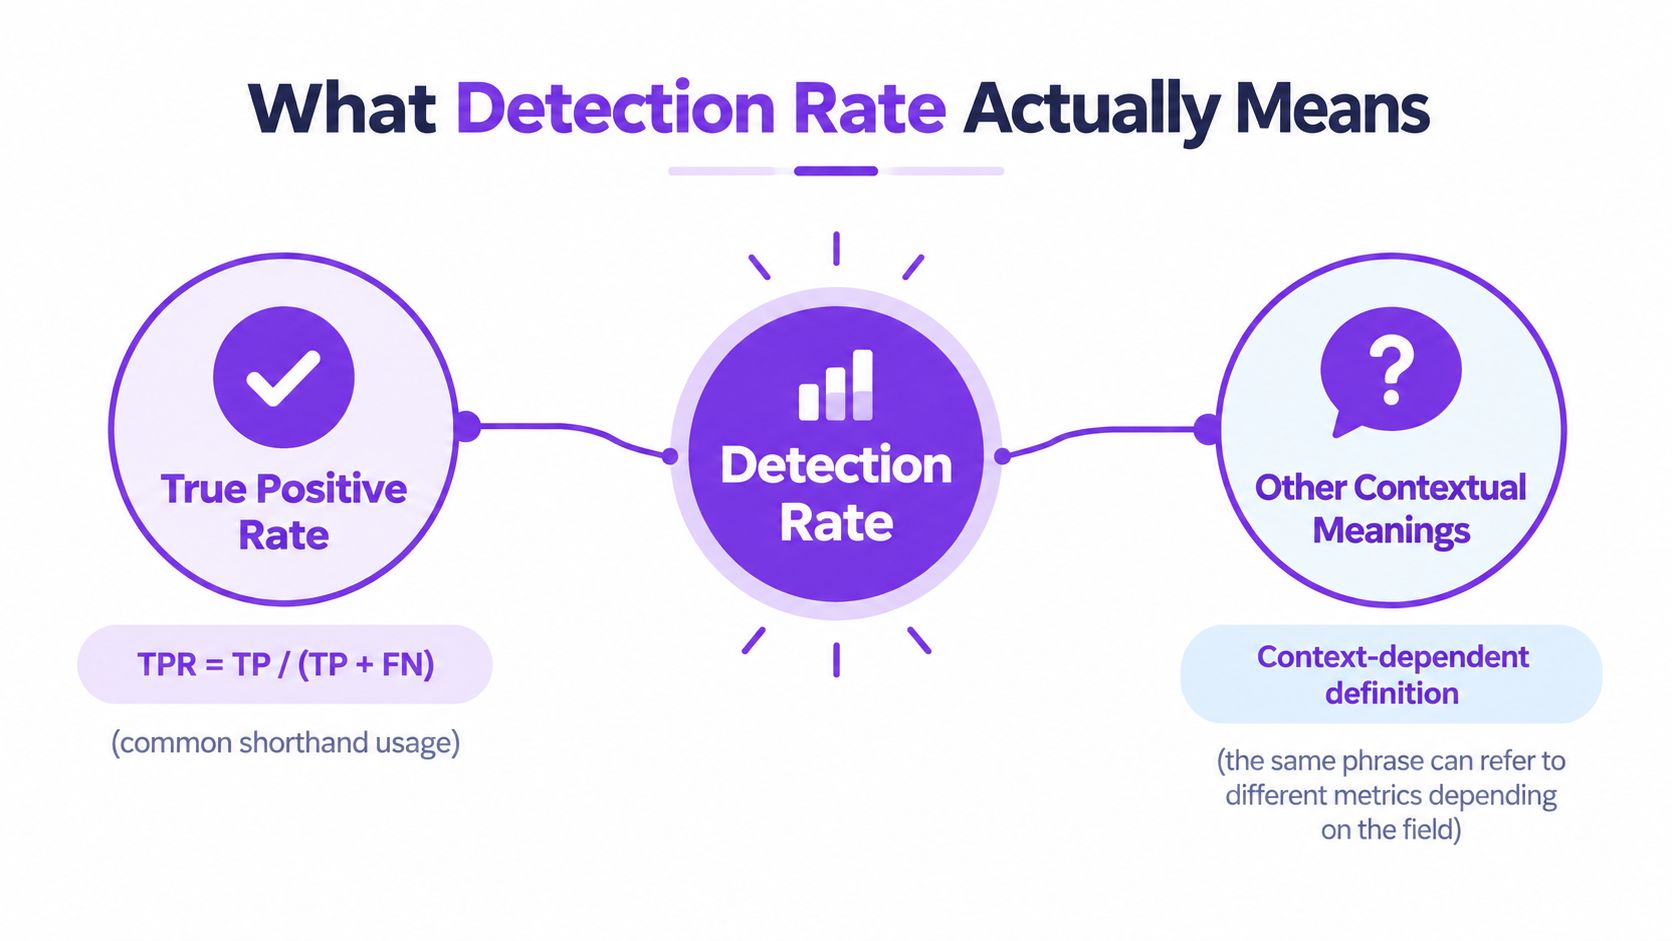
What are you really asking when you ask about detection rate? In most evaluation settings, you are asking a narrow question: of all the images that are AI generated, how many did the detector catch? That meaning is the one this article uses throughout. In machine learning vocabulary, it is the true positive rate, also called sensitivity or recall.
Why the same phrase causes confusion
Product pages, audits, and press coverage don't always use the phrase so carefully. Sometimes detection rate is a loose stand in for overall accuracy, which counts both AI images caught and human images correctly left alone. Those are different questions. A tool can look strong on overall accuracy because your workload contains mostly human images, while still missing a troubling share of the synthetic ones.
The concept map below separates the precise meaning from the looser contextual uses you'll meet in the wild.
Consider grading a spelling test. If a student spells most easy words right but misses most hard words, a total score hides the pattern you care about. Accuracy is the total score. Detection rate asks only about performance on one side of the pile, the actual positives.
Reading habit: When a vendor gives you a percentage, ask which definition produced it before you compare it with anything else.
That question sounds pedantic until you try a side by side comparison. One tool reporting true positive rate and another reporting overall accuracy are not reporting the same thing, even if both use the same two words. Pinning the definition down first protects every later judgment. You won't know whether a number is impressive, adequate, or alarming until you know which pile it was counted from.
How Detection Rate Fits Into the Confusion Matrix
Start with a desk, not a formula. You have a stack of images and you already know the truth about each one, because that's how evaluation works. Your detector sorts them into two piles, AI and human. Now you compare its piles with the truth.
Four outcomes from two piles
That comparison produces four counts. A true positive is an AI image the detector correctly flagged. A false negative is an AI image it missed. A true negative is a human image it correctly left alone, and a false positive is a human image it wrongly flagged.
| Reality | Predicted AI | Predicted Human |
|---|---|---|
| Actually AI | True positive | False negative |
| Actually human | False positive | True negative |
This four cell table is the confusion matrix, and it's the source document for almost every classification metric. Detection rate uses only the top row. You take the true positives and divide by all actual AI images, which is true positives plus false negatives. In shorthand, TP / (TP + FN).
Notice what that leaves out. The bottom row, where false accusations live, doesn't affect this ratio at all. A detector could flag every image as AI, catch every synthetic one, and earn a perfect detection rate while being unusable. That's why readers who stop at this one number often get surprised in practice. Understanding the cost of wrongly flagged human work requires a separate look at how false positive rates behave in image detectors.
The stakes of that missing half show up in real evaluations. A 2024 evaluation of nine academic detectors and five commercial services found most detectors scored below 70% accuracy on altered or adversarial images, while humans scored 65.24% overall and only 61.58% on AI generated images.
The confusion matrix is not jargon for its own sake. It's a reminder that every detector makes two kinds of mistakes, and any honest metric tells you which kind it is counting.
Read the matrix row by row and the metric stops feeling abstract. You're always asking, caught out of how many that were really there?
Detection Rate vs Precision vs Recall
First, clear up a naming trap. Recall and detection rate are the same calculation. Comparing them is comparing a metric with itself. The useful comparison is with the metrics that read the other cells of the matrix.
The visual below puts the main definitions in plain English before we weigh their trade offs.
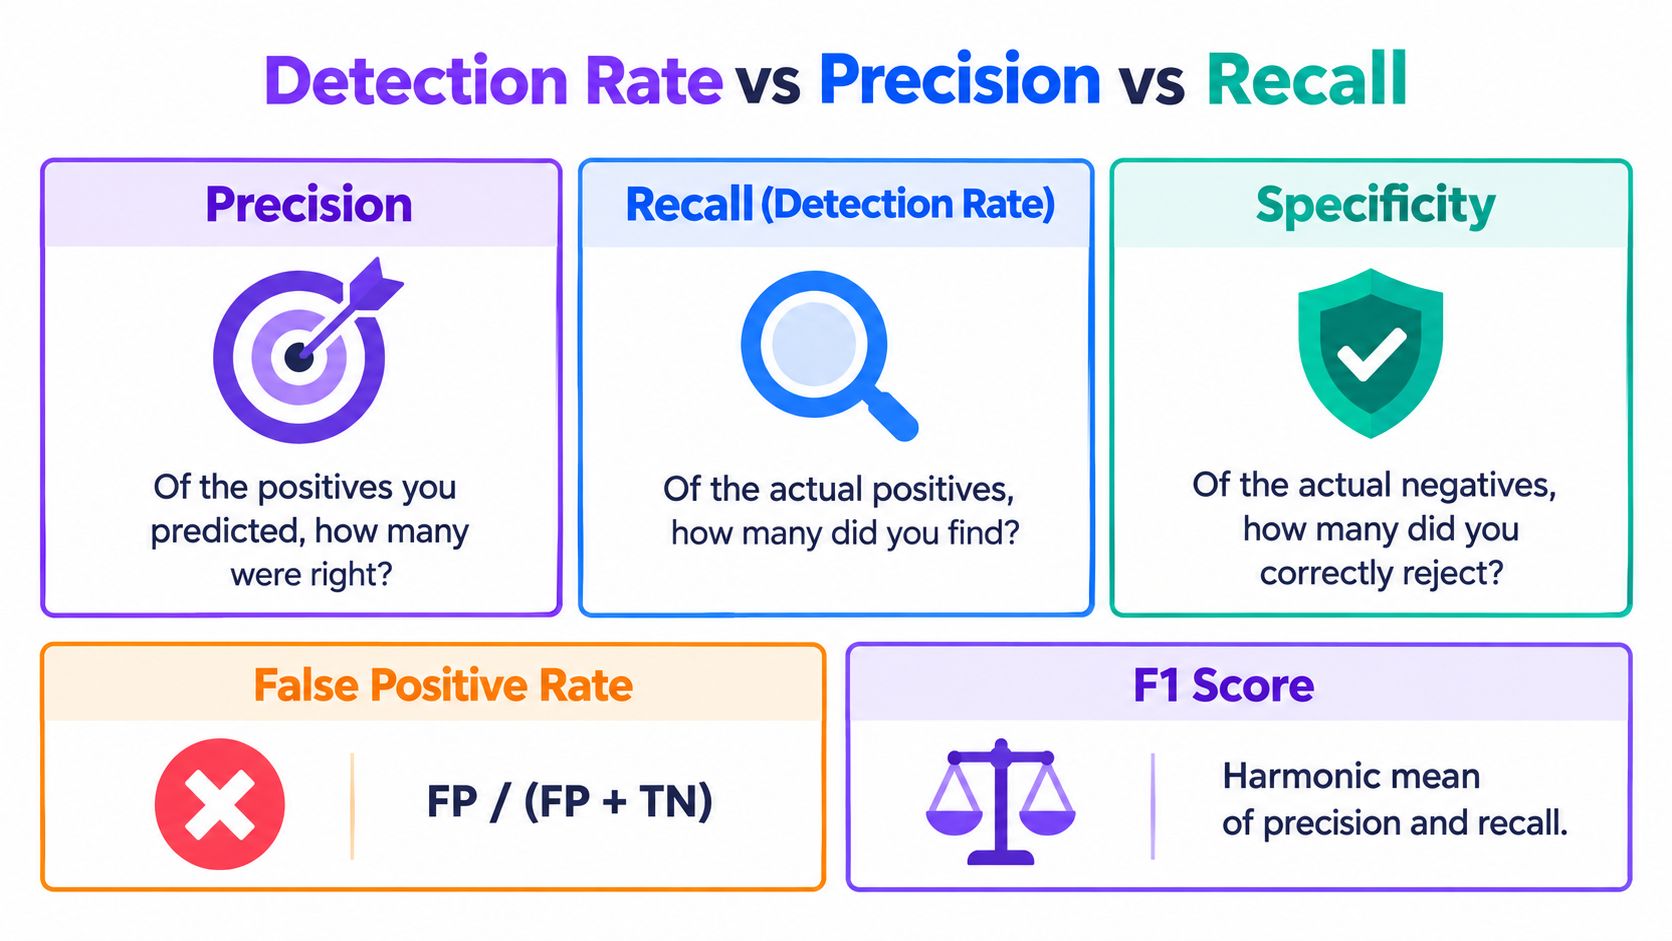
Precision inverts the view: among everything the detector flagged, what share was AI? Specificity mirrors detection rate on the human side, measuring how many human images were correctly left alone. The false positive rate is specificity's shadow, the share of human images wrongly flagged. F1 score blends precision and recall into one number when you want a rough balance between catching and not over claiming.
| Metric | Plain question it answers |
|---|---|
| Detection rate (recall) | Of the AI images in the set, how many did we catch? |
| Precision | Of the images we flagged, how many were right? |
| Specificity | Of the human images in the set, how many did we clear? |
| False positive rate | Of the human images in the set, how many did we wrongly flag? |
| F1 score | How balanced are precision and recall together? |
Two detectors in a fast moving newsroom make the trade off concrete. Detector A catches nearly everything synthetic but flags genuine staff photography often enough that the desk starts ignoring it. Detector B rarely accuses a human image, yet lets a noticeable share of synthetic images through. Neither wins outright. A favors recall, B favors precision, and the right choice depends on whether a missed fake or a false accusation costs your workflow more. A fuller walk through these relationships appears in this guide to classification performance metrics for image detection.
The short video below reinforces that trade off visually, which helps when the formulas start to blur together.
Don't memorize formulas for their own sake. Remember what each one counts. Every metric sees one slice of the matrix clearly and stays blind to the rest.
Calculating and Interpreting Detection Rate in Practice
The arithmetic is simple once the piles are clear. Detection rate = TP / (TP + FN). You need a test set where you know the truth, you run the detector, and you count.
A small worked example
Suppose, purely as an illustration, your test set contains ten AI images and the detector catches eight of them. You have eight true positives and two false negatives. Eight divided by ten gives a detection rate of eight in ten for that test. Change the test set and the same detector can produce a different result, which is exactly the point.
Notice what that example doesn't tell you. It says nothing about how the detector treated your human images. You'd need the bottom row counts for that. Students often assume a strong result on one row implies strength on the other. It doesn't.
Scores you see are not population rates
Production tools rarely hand you a detection rate directly. They give you a confidence score on a single image, sometimes as a percentage style output and sometimes as a band running from Likely Human to Likely AI Generated. AI Image Detector, for instance, returns a confidence score with a verdict across that spectrum rather than a bare yes or no.
That per image score is not a population rate. A high score on one image expresses the model's confidence about that image. A detection rate summarizes behavior across many labeled images. Confusing the two is like confusing one student's confidence about one answer with the class pass rate.
- Trust a score more when it's far from the decision boundary and the image resembles the tool's tested conditions.
- Seek a second opinion when the score sits near the middle or the image has been heavily edited.
- Escalate to human review when the consequence is serious, whatever the score says.
Your workload's base rate matters too. If AI images are rare in your queue, even a decent detector will generate flags that need careful checking before you act. Interpretation is always score plus context, never score alone.
Why the Same Detector Holds on Ten Contexts
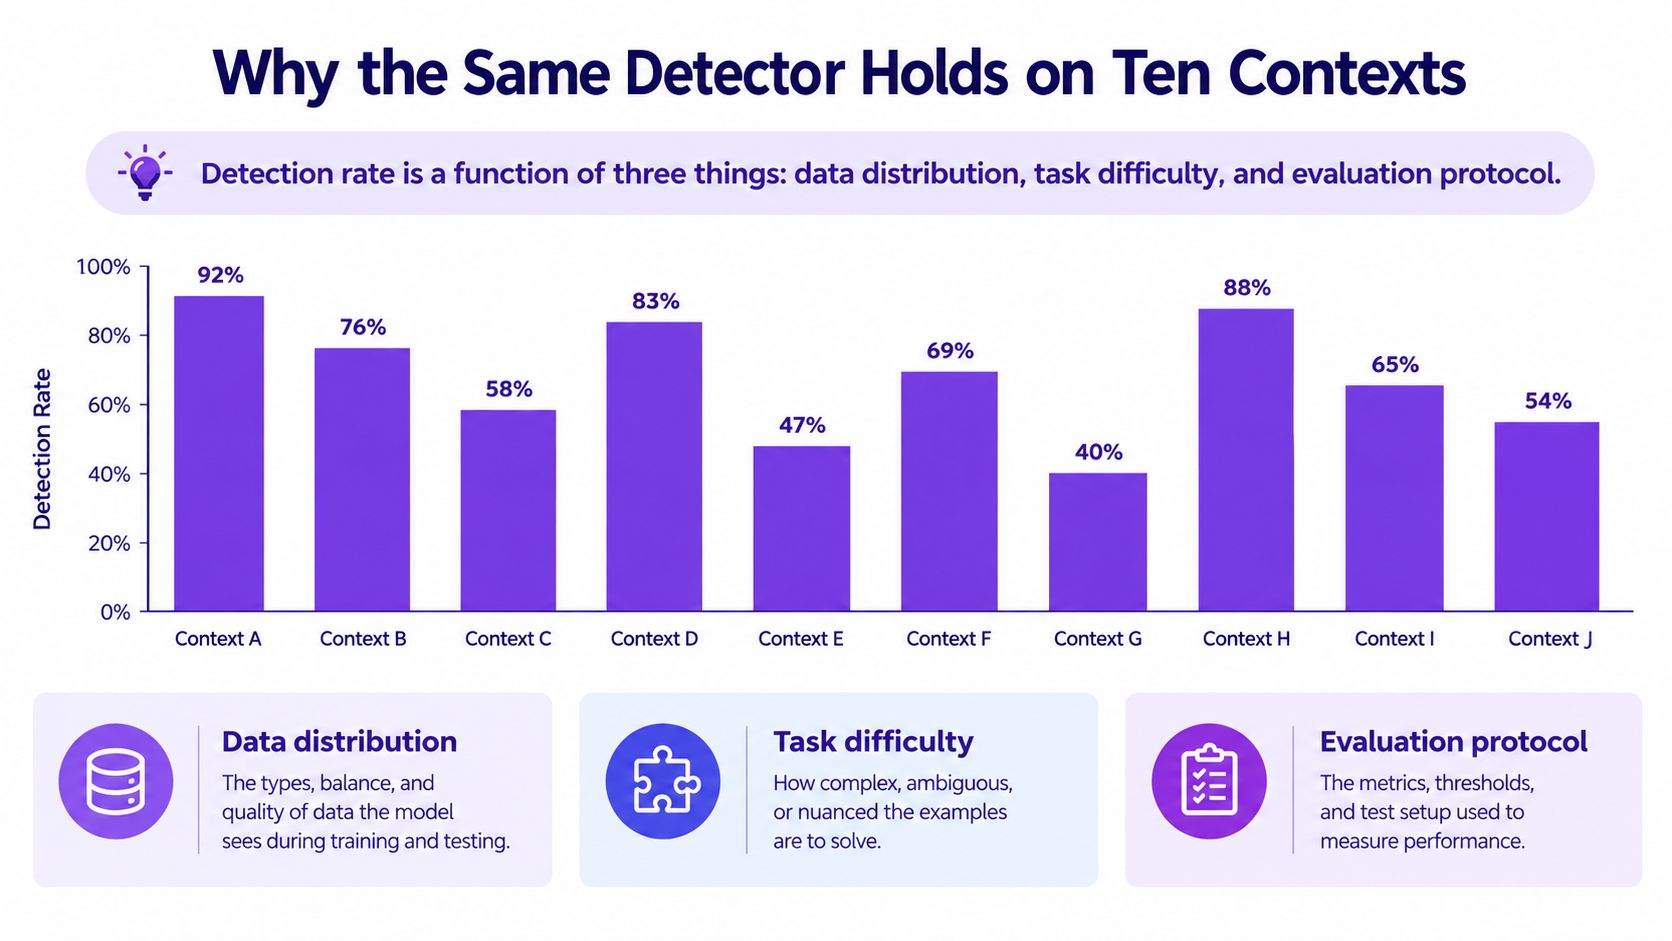
Here's the lesson that changes how you read every vendor claim. Detection rate is not a fixed property of a model, like its file size. It's a result that emerges from the model meeting a particular set of images under particular conditions. Change the images or the conditions and the result moves, sometimes dramatically.
The generator is the biggest lever
The GenImage benchmark results across eight generators make this concrete. A DeiT-S detector averaged 71.56% accuracy across those generators, but its results ranged from 49.80% on ADM to 99.90% on Stable Diffusion v1.4. That's a spread of roughly fifty points from the same detector. In that same benchmark tradition, a ResNet-50 trained on Stable Diffusion v1.4 fell to 54.9% accuracy when tested on Midjourney images.
Why? Detectors learn the fingerprints of the generators they trained on. Show them a familiar generator and they look brilliant. Show them an unfamiliar one and performance can slide toward chance. An average across generators conceals exactly the weakness you'd want to know about.
The chart below illustrates that variability across contexts, and why a single headline bar would mislead you.
Three forces that move the number
- Generator mix: Which engines made the test images, and did the detector train on them?
- Transformations: Resizing, compression, screenshots, and recapture can erode the forensic traces a detector relies on.
- Test set realism: Clean benchmark images are easier than the reposted, edited files people submit in practice.
Think of a detector as a student again. Test her on the exact problem types she practiced and she shines. Give her a new problem type, or a smudged photocopy of the exam, and her score drops. That doesn't mean her first score was fake. It means it was conditional.
A detection rate is a sentence with the conditions left out. Your job as a reader is to put the conditions back in.
So when a claim sounds impressive, don't ask whether it's true. Ask where it's true. Which generators, which edits, which kinds of images? A number without those answers is a grade without knowing which exam was taken.
How to Evaluate a Reported Detection Rate
One number is not enough, and now you know why. The practical move is to turn that skepticism into questions you can ask of any vendor claim, paper, or review. You don't need to be a researcher to ask them well.
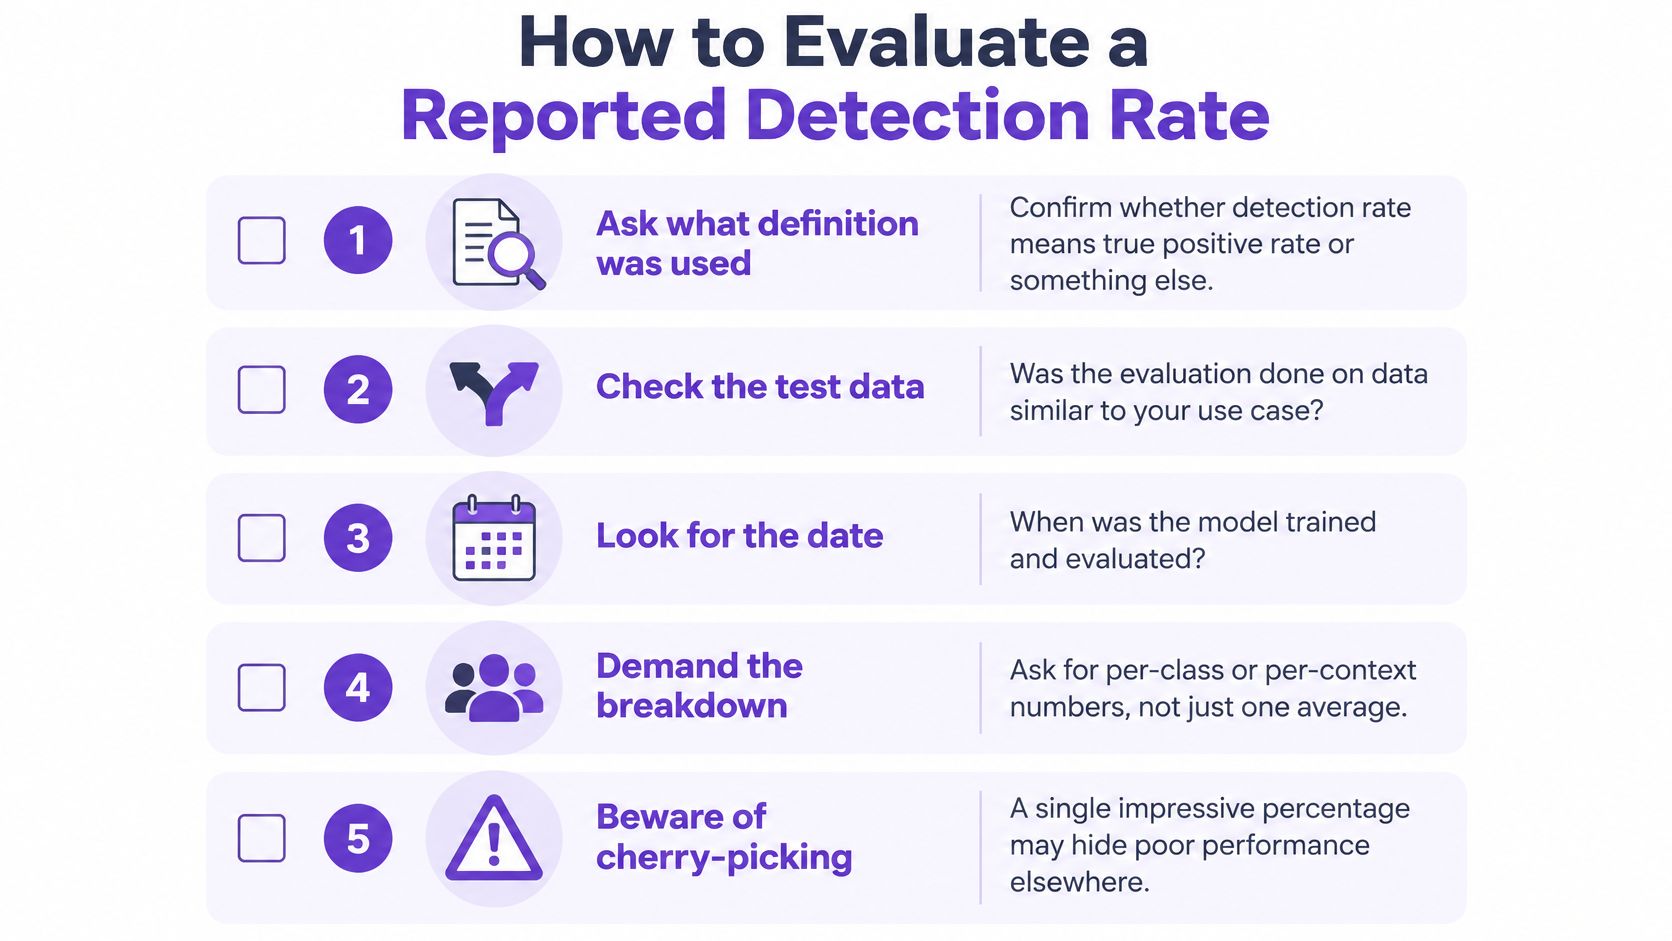
The checklist below gathers the habits that separate a careful reader from a headline reader.
Five questions to ask
- Which definition was used? Confirm the percentage is a true positive rate, not overall accuracy dressed up in friendlier language.
- Which generators were tested? Look for multiple model families, including ones the detector didn't train on.
- What transformations were applied? Compression, resizing, and reposting should be part of the test, not an afterthought.
- Are errors reported separately? You want false positives and false negatives on their own lines, because they carry different costs.
- How large and diverse was the dataset? Small, narrow test sets flatter almost any detector.
Dataset scale alone can shift conclusions. In cross generator testing reported in the GenImage research, growing the evaluation from 1,600 to 162,000 images raised accuracy from 60.9% to 72.1%, while same generator accuracy stayed near 99.9%. That gap is the difference between testing memory and testing generalization.
Teams formalizing this kind of review can borrow structure from resources like Genpire enterprise evaluation, then adapt the questions to image specific risks. For readers who want to see how thresholds trade errors against each other, this explanation of reading ROC curves in detector evaluation is a natural next step.
Watch for the classic pitfall of in distribution testing, where test images closely resemble training images. It produces comforting numbers that evaporate on contact with new generators. A defensible claim tells you not just the score, but the exam, the date, and the breakdown.
Applying Detection Rate in Real Workflows
Context decides whether a given result is reassuring or unacceptable. A social platform triaging huge volumes can tolerate sending borderline cases to reviewers. A teacher considering an academic integrity case can't treat a detector output as proof. The same metric, read responsibly, leads to different actions.
Where the number helps, and where it stops
In journalism, detection supports a verification process that also checks source, provenance, and corroborating evidence. In education, it can prompt a conversation or a closer look at process, but disciplinary decisions need more than a score. Marketplace safety teams use it to prioritize listings for review, while identity verification teams should treat it as one signal among several, because a wrong call locks a real person out.
Real handling conditions reinforce that caution. An ICCV 2025 evaluation of 17 detection methods and 10 vision language models found none reached saturated performance under transmission and re digitization effects, with the best reported accuracy at 89.59%.
Questions readers ask next
- Can I convert a confidence score into a detection rate? Not from one image. You'd need many labeled images, a chosen threshold, and counts of catches and misses.
- What about borderline outputs? Treat the middle band as a request for human review, not as a weak verdict to act on.
- What if two detectors disagree? Disagreement is information. It often signals an unfamiliar generator, heavy editing, or an ambiguous image.
- Should I keep the original file? Yes. Preserve the highest quality version and note any transformations, since processing can change what a detector sees.
Final rule for practice: Use detection rate to judge tools, use confidence scores to prioritize cases, and use evidence beyond the detector to make decisions about people.
That's the healthy mental model. The metric tells you how a tool behaved on a known test. Your workflow decides how much weight that behavior earns. Readers who keep those two jobs separate rarely get misled by a headline percentage, and they rarely overtrust a single score.
Ready to put this reading skill to work on a real image? AI Image Detector gives you a clear confidence score and explanatory verdict in seconds, so you can see how a per image result relates to the population level ideas covered here. Upload a file, check where it falls from Likely Human to Likely AI Generated, and pair that result with the provenance checks this article recommends.
