

Claim Fraud Detection Explained How Insurers Catch Fraud

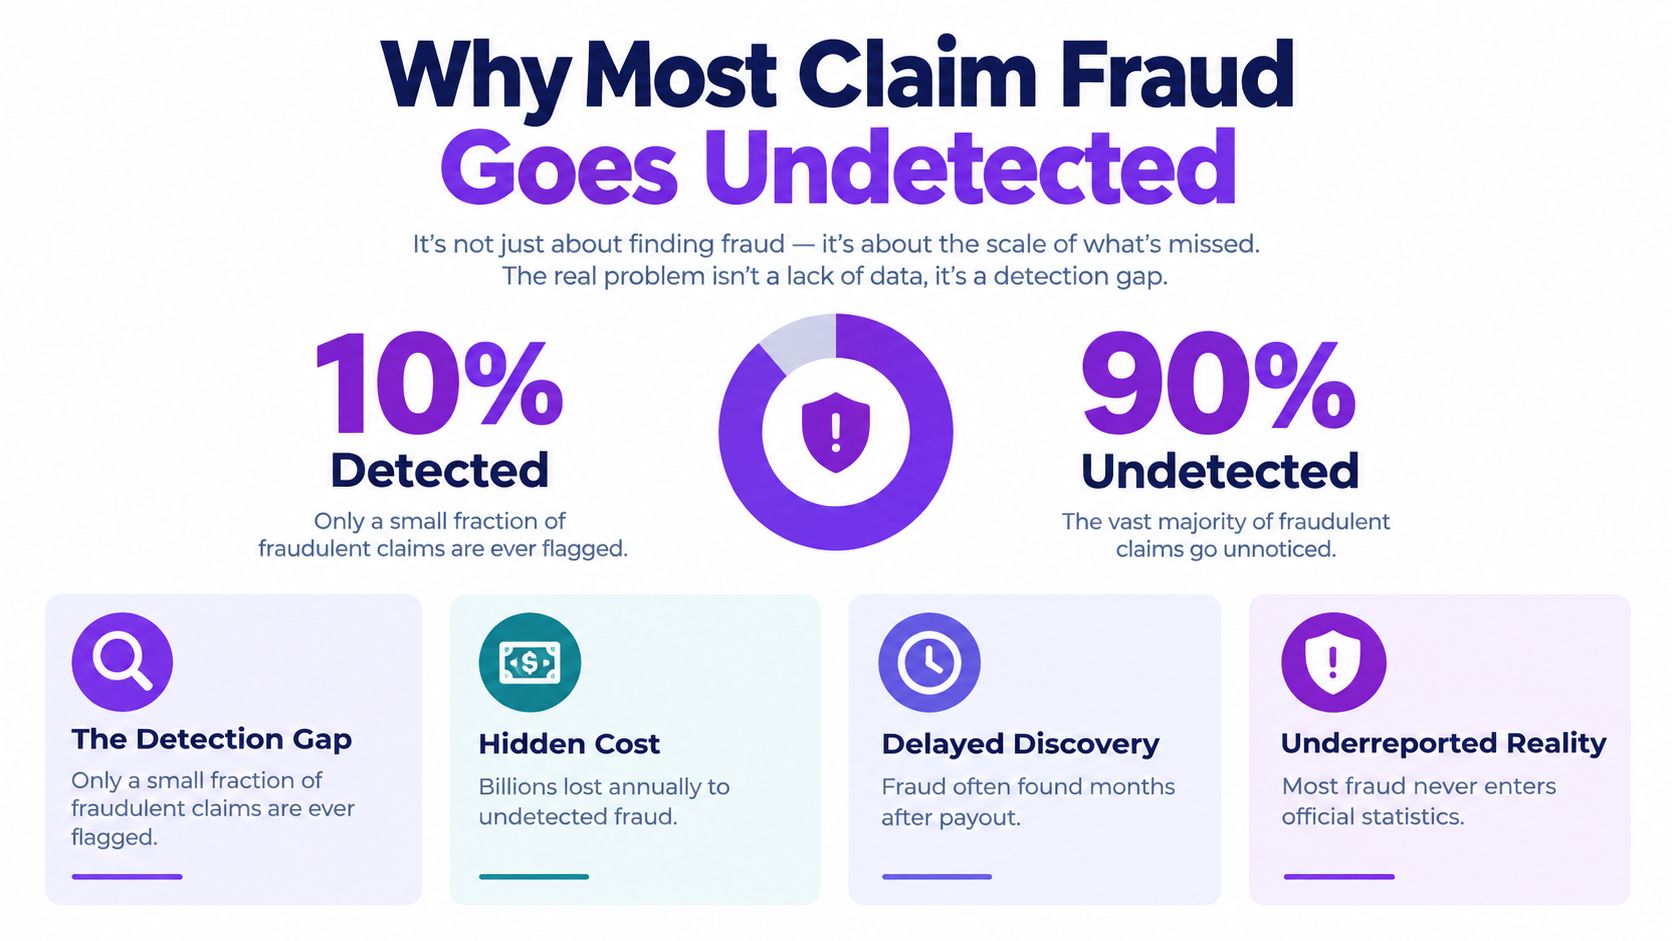
A claims team can process thousands of ordinary files and still miss the few that matter most. That's the uncomfortable truth behind claim fraud detection. Industry reporting puts U.S. insurance fraud losses at about $308.6 billion annually, with property and casualty fraud alone around $45 billion, and says only about 10% of insurance fraud is detected according to this industry summary.
Most picture fraud as a fake receipt or a staged photo. In practice, modern fraud often looks normal at first glance. A single claim might be clean enough to pass. The pattern only appears when you compare it with prior claims, linked people, repeated addresses, shared devices, suspicious providers, or evidence that has been digitally altered.
That's why strong detection programs don't treat fraud as a yes-or-no document check. They treat it as a ranking problem and a relationship problem. The job is deciding which claims deserve human attention first, and which connections across records turn isolated-looking claims into something much larger.
Why Most Claim Fraud Goes Undetected
Only a small share of insurance fraud is ever identified. As noted earlier, industry reporting has estimated detection rates far below the full problem, which helps explain why so many suspicious claims still pass through ordinary workflows.
A low-speed collision claim arrives with believable photos, a repair estimate that fits the vehicle, and a loss story that does not obviously clash with the policy. An adjuster under cycle-time pressure approves it because nothing in that single file clearly justifies a stop.
Three months later, a new claim shows up. Different claimant. Different vehicle. The same repair shop appears again. A mailing address matches a secondary contact from the earlier file. A device fingerprint overlaps with a prior upload. What looked ordinary in isolation starts to look connected.
That pattern explains the miss. Claims teams are usually set up to process routine files quickly. Fraud schemes are often built to stay just below the threshold of a one-file review.
Detection fails when the job is framed too narrowly
New analysts often start with a document-checking mindset. Does the invoice look real? Do the photos match the story? Is the form complete?
Those checks still matter, but they answer only part of the question. Fraud detection works more like airport security triage than like proofreading. The task is to rank which claims deserve attention first, then examine which claims share people, devices, addresses, providers, repair shops, payment details, or timing patterns.
That shift matters because many bad claims are designed to pass basic validation. A synthetic document may look clean. An AI-generated image may appear consistent with the narrative. A staged event may include enough truth to avoid simple rule triggers. The signal often appears only after you compare one claim against a wider network of activity.
Why one-time reviews miss connected schemes
Manual review is strongest when fraud is obvious inside a single file. It gets weaker when each clue is small.
A repeated phone number might mean nothing on its own. So might a reused bank account, a familiar witness, a cluster of late-night submissions, or the same body shop appearing across unrelated losses. Put those pieces together, and the claims start to behave less like accidents and more like an organized ring.
That is why practical field guidance, such as these key indicators to spot trade insurance fraud, helps claims teams. It trains adjusters and investigators to notice signals that sit around the claim, not just inside it.
The ranking problem and the relationship problem have to work together. A score without linkage can bury ring activity inside average-looking files. Linkage without prioritization can swamp investigators with every weak connection in the book.
The real constraint is investigator capacity
Many teams say they want higher fraud recall. In practice, they also need manageable referral volumes.
That trade-off causes misses.
If thresholds are set too high, investigators see fewer cases and subtle fraud slips through. If thresholds are set too low, the queue fills with weak alerts, experienced investigators spend hours clearing noise, and strong leads wait too long. The operating question is not, "Can we detect more?" It is, "Can we rank claims well enough that the next 50 cases reviewed produce more value than the last 50?"
That is a claims operations problem as much as a modeling problem.
What hidden fraud changes inside the claims function
Undetected fraud does more than increase paid loss.
It changes behavior across the team. Adjusters become overly trusting because many suspicious claims look normal. Or they become overly defensive and add friction to legitimate files. SIU units get pulled toward noisy referrals instead of concentrated schemes. Fraud rings learn where your checks happen and shape submissions to pass them.
Good claim fraud detection treats each claim as one piece of a larger puzzle. The practical goal is to decide where a file should rank in the queue, what relationships make it riskier, and when the pattern is strong enough to justify human time.
Understanding Claim Fraud Types and How They Work
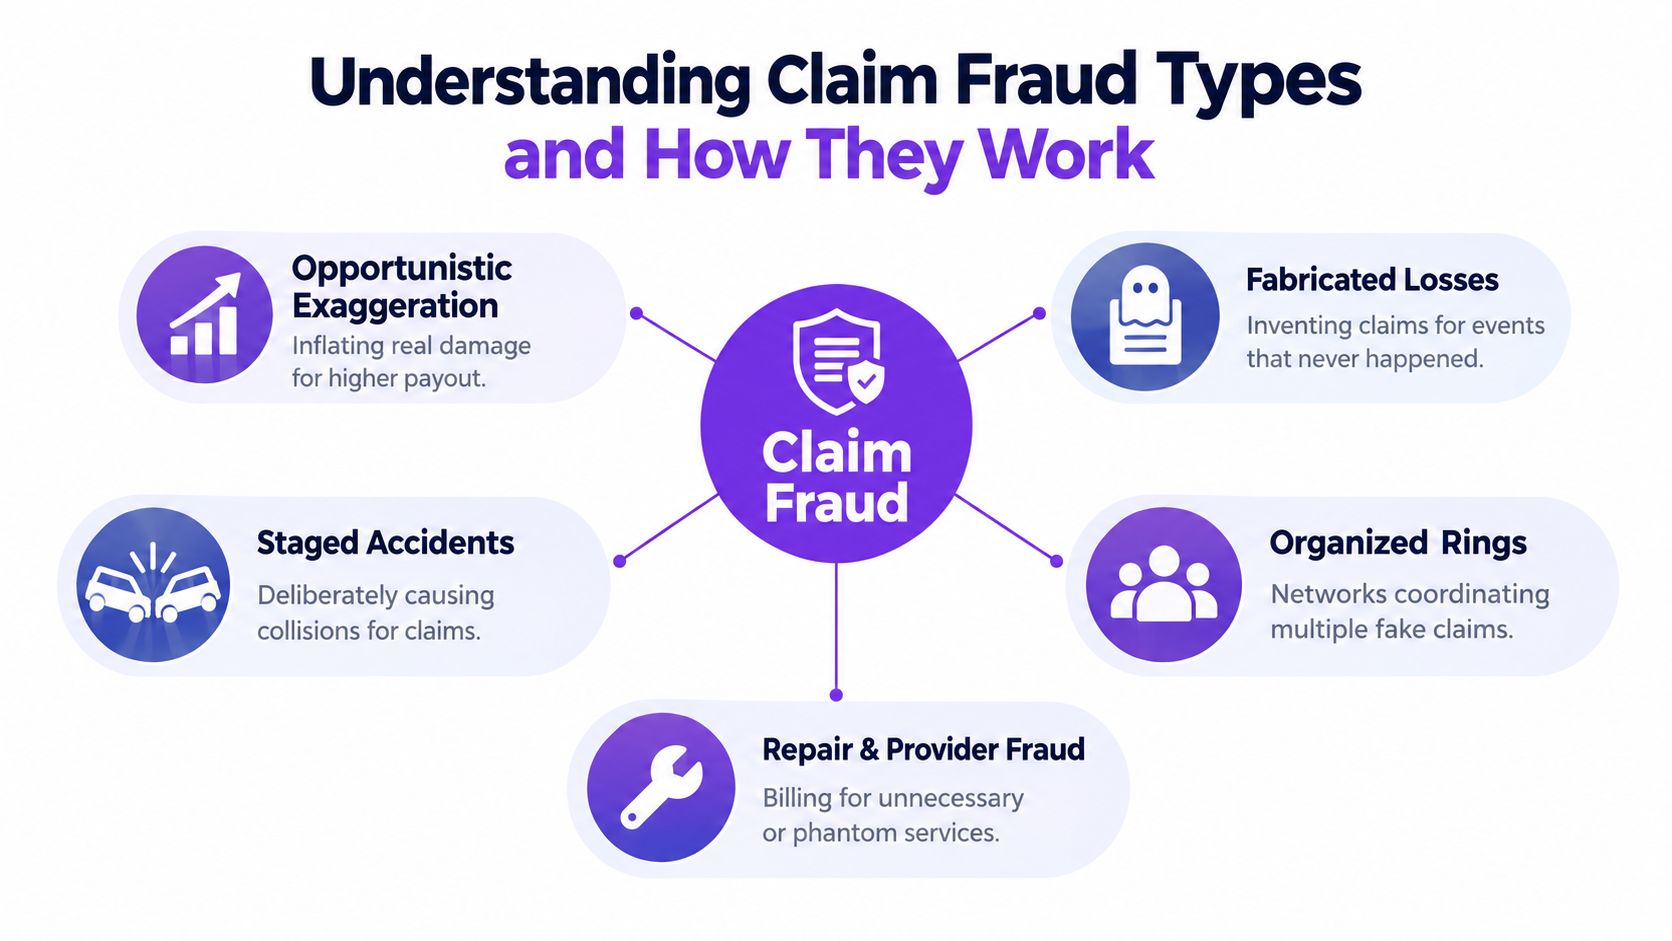
Fraud isn't one behavior. It's a spectrum. New analysts often struggle because they expect a single definition, but claim fraud detection gets easier when you split it into single-claim manipulation and connected-claim schemes.
The simple mental model
Think of fraud as an iceberg.
The visible tip is the obvious stuff. A fake invoice. A claimed loss that never happened. Damage that clearly doesn't match the story. Those cases matter, but they're not the whole problem.
Below the waterline are the claims that contain some real event, mixed with exaggeration, coaching, collusion, or repeat participants. Those are harder to catch because each piece alone can look legitimate.
The main claim fraud patterns
Here are the types new claims and data teammates should recognize early:
- Opportunistic exaggeration happens when a real loss is padded. A bumper scrape becomes a full repair package. Water damage expands to include pre-existing issues.
- Fabricated losses involve events or items that were never lost, damaged, or stolen.
- Staged accidents are arranged events presented as accidental losses, often with rehearsed narratives and repeat actors.
- Provider or repair fraud appears when shops, contractors, or medical providers bill for work that wasn't necessary, wasn't completed, or was inflated.
- Organized rings coordinate people, vehicles, addresses, providers, and supporting evidence across multiple claims.
A lot of teams stop at the first four. The fifth category is where many programs still underinvest.
For a grounding in the document side of this problem, this overview of document fraud detection is a useful companion. It helps separate forged paperwork from broader behavioral fraud.
Later in the workflow, visual evidence deserves the same level of scrutiny.
Why ring fraud changes the game
A ring is a network, not a single bad claim. That means the evidence rarely sits in one place.
A clean-looking claim can still be high risk if it shares the wrong relationships.
Examples of relationship-level signals include:
- Shared addresses: Multiple unrelated claimants using the same location patterns.
- Repeated providers: The same shop or clinic appearing across suspicious clusters.
- Device overlap: Upload activity tied to the same phones or browsers.
- Contact reuse: Similar phone, email, or alternate contact details across claims.
- Narrative similarity: Near-identical descriptions that suggest coaching or templating.
Newcomers often get confused. They ask, “Is this claim fraudulent?” The better question is, “What other records make this claim more or less concerning?”
How Claim Fraud Detection Techniques Compare
A claims team usually does not fail because it lacks one perfect fraud tool. It struggles because each tool answers a different question, and the team treats them as if they all do the same job.
That distinction matters in production. Fraud detection is less like checking a form for missing fields and more like staffing an emergency room. You are ranking cases by who needs attention first, while knowing investigators can only review a limited number each day.
Rules ask whether a claim broke a known condition. Anomaly methods ask whether the pattern looks unusual. Supervised models ask whether the claim resembles previously confirmed fraud. Relationship analytics ask what else this claim touches across people, vehicles, devices, providers, and prior losses.
Used together, these methods create a queue, not a verdict.
What each technique is good at
Rules work like guardrails. They are useful for hard contradictions, policy violations, watchlist matches, and required controls. New claims teams often like rules because they are easy to explain. The tradeoff is simple. Rules catch what you already know to look for.
Anomaly detection helps when fraud shifts shape. Instead of checking for one named scheme, it looks for combinations that do not fit the normal claim population. That can surface early fraud behavior, but it also creates noise. A rental extension after a severe loss may be unusual and still completely legitimate.
Supervised machine learning is usually the best ranking tool once you have labeled outcomes and enough history to learn from them. In practice, claims teams often find that tree-based models rank suspicious claims well because they handle messy interactions, such as reporting delay plus repair estimate pattern plus claimant history. The useful lesson for adjusters and SIU leaders is operational, not academic. A score helps decide review order. It does not close the claim for you.
For context on broad workflows and common tooling patterns, this primer on insurance claim fraud detection maps well to claims operations teams.
Relationship analytics adds a different layer. It is the method that turns single-claim review into connected-claim review. That matters for organized fraud and for AI-assisted abuse, where one document or photo may look polished on its own, but the surrounding pattern gives it away. Reused contacts, repeated devices, familiar repair shops, or clusters of near-identical narratives often matter more than one suspicious field.
Detection Techniques Compared by Use Case and Trade Off
| Technique | Best For | Strengths | Limitations |
|---|---|---|---|
| Business rules and watchlists | Known red flags and policy violations | Easy to explain, fast to deploy, reliable for repeat triggers | Misses new fraud patterns, can become stale |
| Anomaly detection | Rare or unusual claims activity | Finds outliers without needing full fraud labels | Can generate many false alarms |
| Supervised models such as XGBoost and Random Forest | Prioritized scoring based on historical patterns | Strong ranking performance, handles complex feature interactions | Depends on label quality and threshold tuning |
| NLP on notes and documents | Adjuster text, claimant narratives, supporting paperwork | Pulls signal from unstructured text and inconsistencies | Sensitive to note quality and inconsistent language |
| Image and document forensics | Photos, receipts, scans, visual evidence | Useful for edited or synthetic evidence review | Doesn't reveal broader network relationships |
| Graph or relationship analytics | Rings, shared entities, hidden coordination | Exposes patterns invisible in one claim | Needs identity resolution and cross-system data quality |
A practical example
Suppose a vehicle damage claim includes photos that do not fully match the reported vehicle details. A handler might also perform a VIN lookup to verify the year, trim, and core identifiers before deciding whether the issue is a documentation mistake, a synthetic submission, or part of a broader pattern.
Now add one more step. If that same vehicle, phone number, repair shop, or upload device appears across other questionable claims, the decision changes. The file is no longer just a document check. It becomes a ranking and relationship problem.
That is the comparison that matters most in real claims operations. Rules and forensic checks help validate pieces of evidence. Models and graph methods help decide which claims deserve scarce investigator time first, and which clean-looking claims deserve a second look because of who and what they are connected to.
Data and Features That Power Accurate Detection
A fraud model is closer to a triage nurse than a lie detector. Its job is to sort incoming claims by who needs attention first, based on the patterns hidden in the file and around it.
That is why feature quality matters more than algorithm debates. If your data only describes one claim in isolation, the model will mostly behave like a document checker. If your data captures timing, reuse, and connections across claims, the model can rank risk the way investigators work.
Start with raw operational data
A widely used motor insurance benchmark study used 15,420 claims and 33 features, with each row capturing policyholder, vehicle, accident, and claims-process attributes, and it found that XGBoost with SMOTE plus category weighting detected more than 90% of fraudulent claims as documented in this benchmark study. The practical lesson is simple. Useful fraud signal usually sits across several parts of the claim record, not in one field.
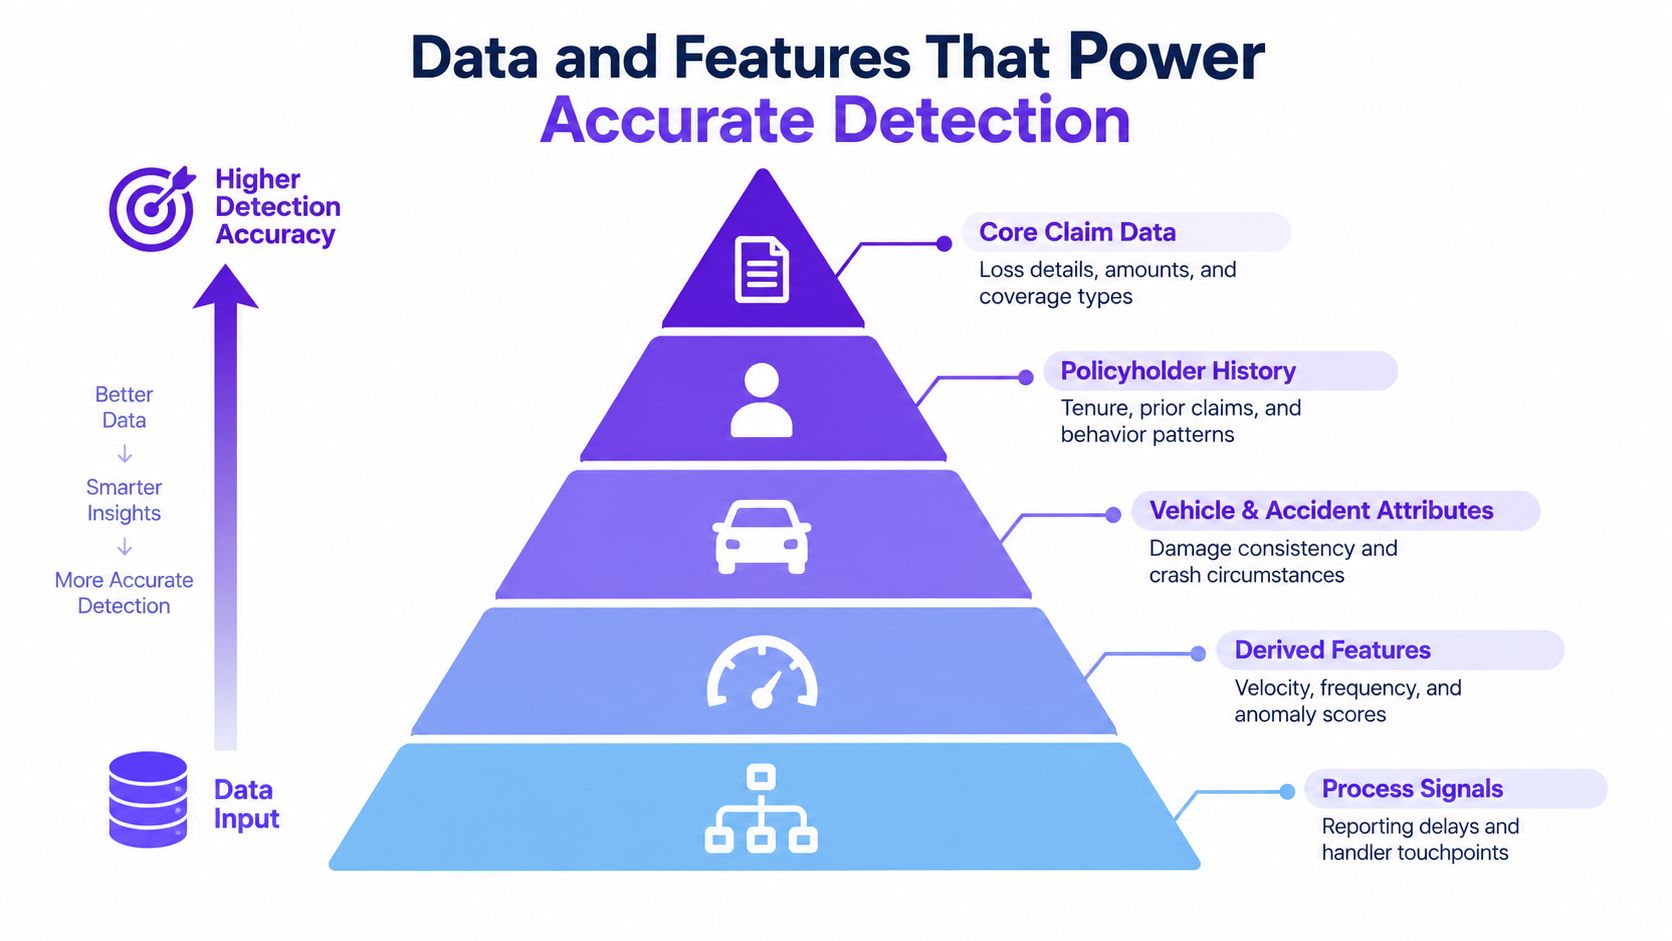
Core inputs often include:
- Claim details: loss type, timing, amount, location, claimed items, injury or repair information
- Policyholder history: prior claims, policy tenure, coverage changes, cancellation patterns
- Vehicle or property attributes: age, value, prior condition, usage patterns
- Accident context: reported sequence, participants, weather or scene details when available
- Process fields: reporting delay, number of touchpoints, reassignment count, documentation sequence
These fields are the ingredients. They are rarely the meal.
Then turn fields into behavior
Raw columns tell you what was entered. Features tell you what the behavior may mean.
A reporting delay, by itself, may be harmless. A reporting delay right after coverage changes, followed by late document uploads from a device seen on other suspect claims, is a different story. That is the shift from file review to ranking.
Useful engineered features often include:
- Velocity features that measure how fast claims, endorsements, or uploads happen
- Consistency features that compare related facts, such as accident timing against policy changes or repair details against vehicle age
- Frequency features that show repeated use of shops, addresses, phone numbers, bank accounts, or payment destinations
- Relationship features that count or score shared entities across claims
- Process-friction features that capture resubmissions, corrections, reopened tasks, or repeated evidence updates
Field lesson: One shared phone number may be noise. Ten suspicious claims tied to the same phone number is a pattern.
Relationship data changes what the model can see
This is the part newer teams often miss.
Fraud detection gets much stronger when features describe how claims relate to each other. Shared address. Shared repair shop. Shared claimant representative. Shared upload device. Shared bank account. Shared witness. Each link may be weak on its own. Several links together can point to coordinated behavior or ring activity that looks ordinary inside a single file.
The same logic now matters for synthetic and AI-generated submissions. A polished note or realistic image can pass a surface check. The surrounding metadata often gives the better clue: repeated templates, common submission paths, unusual upload timing, reused identities, or clusters of claims that move through the process in near-identical ways.
Class imbalance affects feature strategy
Fraud is rare, so teams need features that help the model separate a small number of important claims from a large queue of ordinary ones. More rows do not fix that by themselves. Better labels, better relationship data, and features tied to real fraud behavior usually matter more.
That also explains why claim fraud detection is not just a data collection exercise. It is a prioritization exercise. The strongest feature set helps the model rank claims so investigators spend time where the combination of suspicion, connection, and potential loss is highest.
Measuring Success and Tuning for Investigator Workload
Fraud teams don't need a model that wins a classroom exam. They need a model that sends the right work to the right people at the right volume.
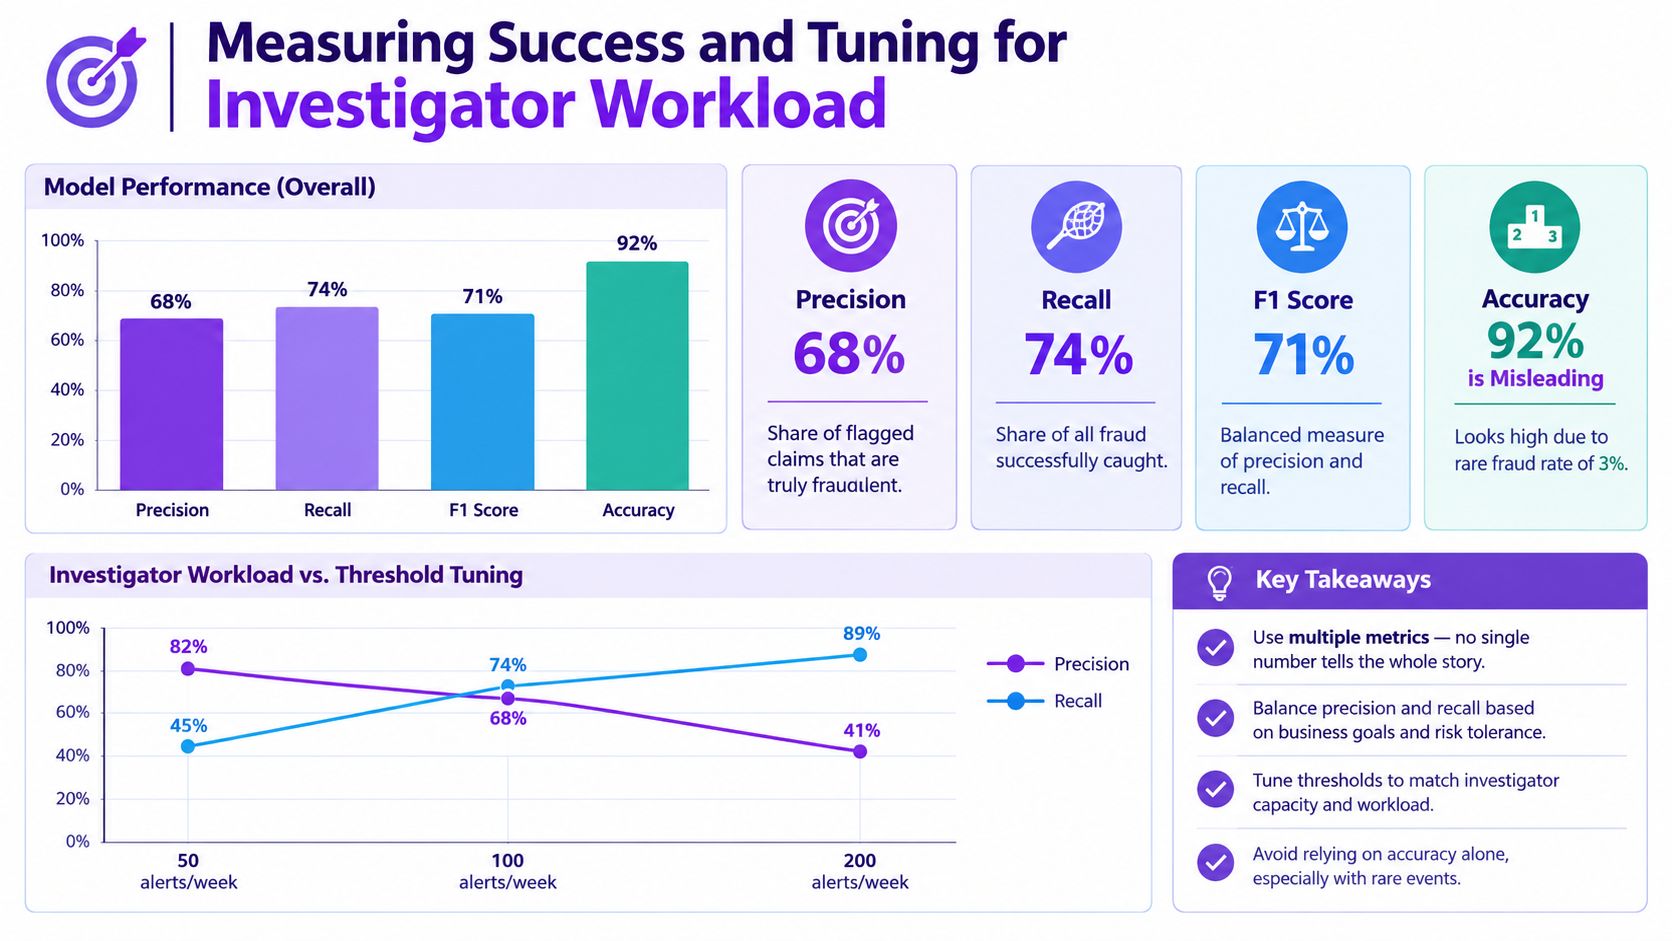
That's why accuracy is often the least useful headline metric in claim fraud detection. If fraud is rare, a model can score high on accuracy by approving almost everything.
The metrics that match real work
The metrics that matter most are easier to understand than people think:
- Precision asks: of the claims we flagged, how many were worth flagging?
- Recall asks: of the fraud that existed, how much did we catch?
- F1 balances those two when you don't want to optimize only one.
- Ranking quality asks whether the most suspicious claims rise to the top of the queue.
One insurance claims study reported XGBoost precision of 79.9%, meaning about 2 in 10 claims flagged as fraudulent were still false alarms in this review of insurance fraud models. That's not a model failure. It's a staffing and threshold question.
Thresholds control workload
If you lower the threshold, you catch more potential fraud. You also send more false positives to adjusters and SIU. If you raise it, your alerts get cleaner, but you'll miss more suspicious activity.
That tradeoff is why teams should read up on false positive rates before tuning production queues. In practice, every threshold decision is also a workload decision.
A useful way to talk about this with nontechnical stakeholders is simple:
- High recall mode suits early screening when you can tolerate more noise.
- High precision mode suits scarce investigator capacity.
- Mixed mode works when you rank the queue and review only the top slice first.
Don't ask whether the model is good. Ask whether the next 50 alerts it sends are worth an investigator's week.
Why ensembles often help
The same line of research found that a hard-voting ensemble of Logistic Regression and XGBoost reached 83.0% accuracy with 91% precision in the same insurance study summary. That's useful because it shows how combining complementary models can improve alert quality when manual review capacity is limited.
For operational teams, the lesson is straightforward. You're not choosing a model for bragging rights. You're choosing how many people need to review how many claims, and what level of leakage you can accept if they don't.
Putting Detection Into the Claims Workflow
A model that lives in a notebook doesn't reduce fraud. Detection only matters when it shapes live claims decisions.
The workflow usually starts at first notice of loss. The system checks for basic rule triggers, verifies known entities, scores the claim, and decides what happens next. Low-risk claims continue through standard handling. Medium-risk claims may need extra documentation or targeted verification. High-risk claims move into a referral path with specific reasons attached.
What a working operating model looks like
The strongest setups use a layered flow:
- Initial intake screening checks structured fields, timing signals, and obvious rule hits.
- Evidence review examines documents, notes, and visual material for manipulation or mismatch.
- Relationship analysis links the claim to people, vehicles, providers, addresses, and devices already in the ecosystem.
- Human review decides whether to pay, pause, deny, or investigate further.
- Feedback capture records what happened so future models learn from the outcome.
That middle layer matters more than many teams realize. Recent industry commentary argues that fraud is increasingly an identity-resolution problem, not just a single-claim problem, because rings only become visible when connections across records are analyzed as discussed in this analysis of entity resolution and fraud.
AI-generated evidence changes the workflow
Claims teams also need a plan for synthetic evidence. A 2026 survey reported that 98% of insurers said AI editing tools are fueling digital fraud, while only 32% said they felt very confident detecting deepfakes in this SAS insurance fraud research report. That gap tells you the workflow can't stop at intake.
For visual evidence review, teams may add specialist tools alongside broader fraud platforms. One option is AI Image Detector, which checks whether an image appears AI-generated or human-created. In a claims setting, that kind of review fits best as a verification layer for submitted photos rather than as a standalone fraud decision.
Governance matters as much as scoring
A good workflow doesn't just flag risk. It records why.
Claims staff need reason codes they can understand. Investigators need a case trail that shows which entities linked the claim to other activity. Governance teams need auditability, especially when synthetic media is involved.
Independent and industry commentary also points to a broader reality. Adoption is growing, but point-in-time screening isn't enough. Programs increasingly need layered verification, continuous monitoring, and governance around AI-manipulated claims, a challenge serious enough that regulators in South Korea have moved to update fraud rules because conventional screening systems cannot reliably detect AI-manipulated claims as summarized in this Verisk resource on the state of insurance fraud.
Next Steps Privacy Ethics and Building Your Tech Stack
If you're building a fraud program or modernizing one, start with the operating problem, not the vendor category. Ask where your process leaks. Is it obvious fraud you're missing, digital evidence you can't verify, or connected activity nobody can see across systems?
A practical build order
For teams, a sensible progression looks like this:
- Begin with rules plus one supervised model: That gives you immediate triage discipline without overcomplicating the stack.
- Add text and document review: Notes, narratives, and submitted paperwork often contain inconsistencies that structured fields hide.
- Introduce visual verification: Photo-heavy claims need checks for editing, manipulation, and synthetic generation.
- Expand into relationship analytics: Ring detection gets stronger because shared entities become first-class signals.
- Close the loop operationally: Every referral outcome should feed back into labeling, threshold review, and control updates.
Privacy and fairness need design choices
Fraud teams can't treat data access as unlimited just because the use case is valuable.
A responsible stack should include:
- Data minimization: Keep only the signals needed for the fraud task.
- Access controls: Limit who can view linked evidence and relationship graphs.
- Audit trails: Record why a claim was scored, escalated, or held.
- Bias checks: Review whether certain proxies create unfair or unstable outcomes.
- Human escalation rules: Reserve final adverse decisions for trained staff, especially when the evidence is ambiguous.
Strong claim fraud detection doesn't mean treating every claimant like a suspect. It means applying scrutiny where the evidence justifies it.
What good early execution looks like
You don't need a perfect graph platform on day one. You do need a process that's teachable, measurable, and reviewable.
A strong pilot usually has these traits:
- Clear use case: Pick one line or claim type with enough volume and known pain points.
- Narrow alert design: Start with a ranked queue, not a flood of hard-stop referrals.
- Outcome tracking: Measure which alerts investigators found useful and which they ignored.
- Evidence standards: Decide in advance what kinds of model flags require supporting documentation.
- Retraining discipline: Refresh models based on outcomes, not on wishful thinking.
That's the practical mindset shift. Claim fraud detection works best when you stop asking for a magic fraud score and start building a system that ranks risk, verifies evidence, exposes relationships, and respects privacy at every step.
If your team needs help reviewing suspicious photo evidence, AI Image Detector gives you a privacy-first way to check whether submitted images appear AI-generated or human-made. It fits naturally into claim fraud detection as one verification layer inside a broader workflow, especially when adjusters need a fast second look at visual evidence before escalating a file.